Tuesday, February 11, 2020

CO2 air quality monitor with Telegram notification

Introduction


CO2 Air Quality Monitoring System with Telegram notification


Purpose


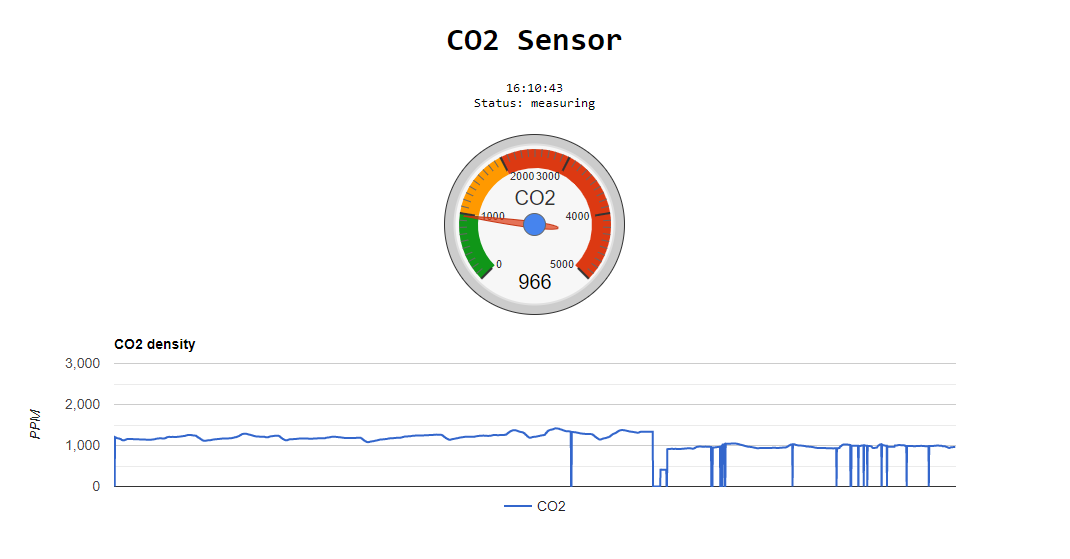
The aim of this project is to receive Telegram notification when CO2 air quality is higher than certain level from Wemos. It uses MH-Z19B sensor to measure CO2 air quality and visualizes the result with Google Chart API. CO2 measurement data is presented in gauge type. We can check current status via web browser using WiFi connection.

Features


This project is based on our previous projects,

IoT Laboratory: CO2 air quality monitor with Line notification V2
IoT Laboratory: CO2 air quality monitor with Line notification

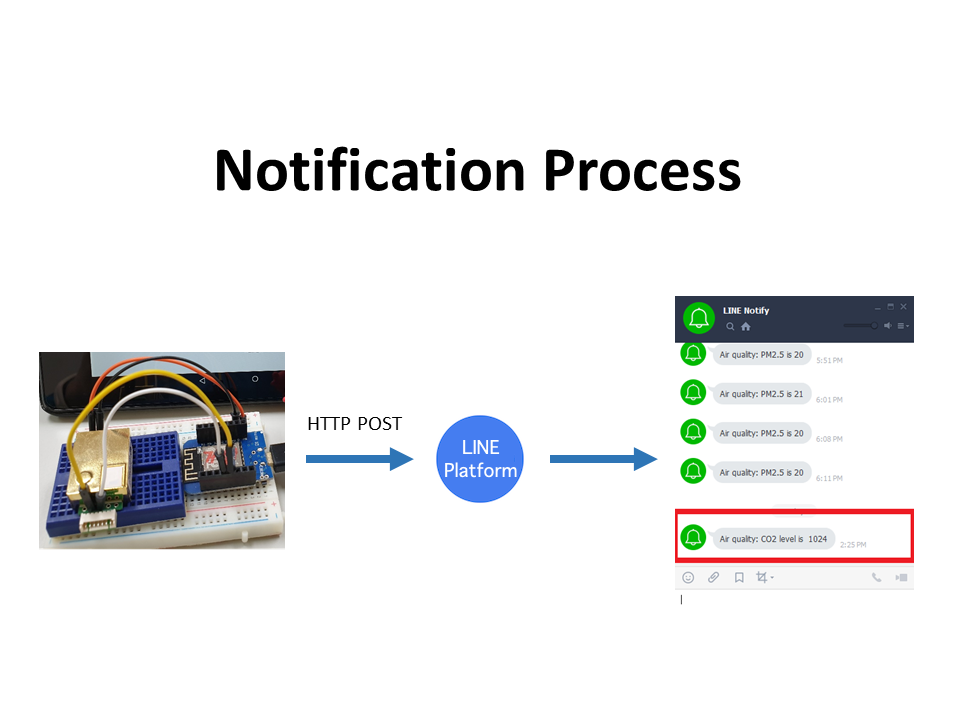
It replaces Line notification with Telegram notification.  A user will be notified by Telegram when the level of CO2 hits a certain level which is specified by the user in the source code. The entire process for sending Telegram notification is like below. Wemos sends HTTP GET request to Telegram server, then, the message will be delivered to our Telegram messenger.


For web server, we use ESPAsyncWebServer library and it is available at github. Additionally, we need to install EPS8266 Sketch Data Upload to upload web server related files to Wemos. For example, in this project, we use HTML, Javacript, and CSS files under data directory. In other words, we need to upload sketch and web related files separately.

Prerequisites


- Arduino IDE
ESP8266 package for Arduino IDE
EPS8266 Sketch Data Upload
ESPAsyncTCP Library
ESPAsyncWebServer Library
- Telegram Bot token and chat id
Requirements


Hardware
-Wemos D1 mini : US$1.77 on Aliexpress
-MH-Z19B CO2 sensor : US$17.90 on Aliexpress

Instructions


Step 1. Setup hardware

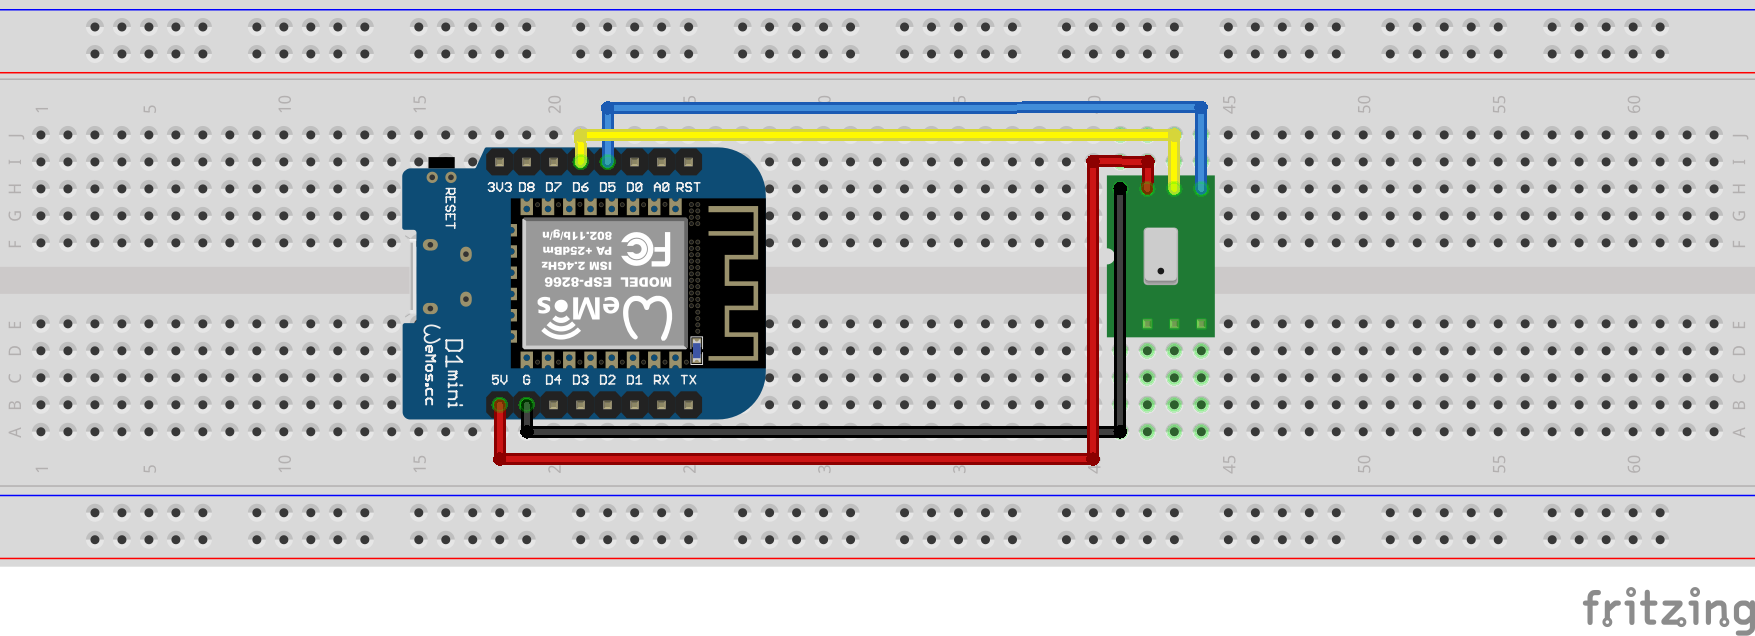
MH-Z19B sensor has many pins, but, we only use TX, RX, VCC, and GND pins. Connect TX of MH-Z19B to D5 of Wemos, RX to D6, VCC to 5V, and GND to G. Finally, connect micro usb to Wemos for uploading firmware, and check serial monitor and serial plotter in Android IDE to make sure the sensor works correctly.


Step 2. Create Telegram account and bot

To be able to receive Telegram notification, we need two things; bot token and chat id. Bot token is generated automatically when we create a new bot. Then, send a request on web browser to Telegram. After that, Telegram sends a response with chat id in it. This process looks a little bit complicated at first, but, I found an easy and useful tutorial on Youtube. It would be extremely helpful if you are not familiar with Telegram.

Step 3. Upload sketch to Wemos D1 mini

This step is to upload sketch to Wemos as usual. In the following sketch, following values need to be modified with your own.

WIFI_SSID  : Name of WiFi router
WIFI_PASS  Password of WiFi router
- TG_TOKEN   : Token of Telegram bot
TG_CHAT_ID Chat id that the bot will be sending message to

In this example sketch, it send Line notification only when CO2 density hit 1000 or higher. And before sending again it waits 10 minutes. These values can be changed by user.

notifyLevel    : CO2 threshold for Line notification
- notifyInterval : Waiting time (specify in milliseconds)


/**
* CO2 air quality monitoring system using MH_Z19B sensor with WIFI, WEBSERVER, Telegram NOTIFY
*
* Hardware : Wemos D1 mini, MH_Z19B
* Software : Arduino IDE, EPS8266 Sketch Data Upload
* Library : ESPAsyncTCP, ESPAsyncWebServer
*
* JSON format
* {'status':'starting'|'preheating'|'measuring', 'co2':0~5000, 'uptime': 120}
*
* Cautious!
* After cold start, it takes about 70 seconds for MH_Z19B to preheat itself. During this period,
* the reading will be somewhere between 410 and 430. But, after preheating period, it starts showing
* actual CO2 density. Therefore, it is recommended to read sensor after 70 seconds at least.
*
* MH-Z19B Manual:
* https://www.winsen-sensor.com/d/files/infrared-gas-sensor/mh-z19b-co2-ver1_0.pdf
* Telegram API Reference :
* https://core.telegram.org/bots/api
*
* February 2020. Brian Kim
*/
#include <SoftwareSerial.h>
#include <ESP8266WiFi.h>
#include <ESPAsyncTCP.h>
#include <ESPAsyncWebServer.h>
#include <FS.h>
#include <WiFiClientSecureAxTLS.h>
/**
* WiFi credentials
*/
#define WIFI_SSID "your_ssid"
#define WIFI_PASS "your_password"
/**
* Telegram credentials
*/
#define TG_TOKEN "your_telegram_token"
#define TG_CHAT_ID "your_telegram_chat_id"
/**
* MH_Z19B sensor pin map and command packet
*/
#define MH_Z19B_TX D5 // GPIO12
#define MH_Z19B_RX D6 // GPIO14
#define MH_Z19B_CMD 0xFF
#define MH_Z19B_RES 0x86
#define MH_Z19B_DATA_LENGTH 9
byte _cmd[MH_Z19B_DATA_LENGTH] = {MH_Z19B_CMD,0x01,MH_Z19B_RES,0x00,0x00,0x00,0x00,0x00,0x79};
/**
* Wemos serial RX - TX MH_Z19B
* TX - RX
*/
SoftwareSerial _serial(MH_Z19B_TX, MH_Z19B_RX); // RX, TX
AsyncWebServer server(80);
int _co2, _temp;
String status = "starting";
unsigned long uptime;
unsigned long previousMillis = 0;
const long notifyInterval = 600000; // Waiting time(milliseconds)
const int notifyLevel = 1000; // CO2 threshold for notification
bool waitFlag = false;
/**
* Preheating timing
*/
unsigned long startupMillis = 0;
/**
* Measuring interval
*/
unsigned long measuringMillis = 0;
const long measuringInterval = 5000; // Waiting time(milliseconds)
void connectWifi() {
WiFi.mode(WIFI_STA);
WiFi.begin(WIFI_SSID, WIFI_PASS);
while (WiFi.status() != WL_CONNECTED) {
delay(500);
Serial.print(".");
}
Serial.println("");
Serial.println("WiFi connected");
Serial.print("IP address: ");
Serial.println(WiFi.localIP());
}
/**
* Notify Telegram
* https://api.telegram.org/bot__TOKEN__/sendmessage?chat_id=__CHAT_ID__&text=__MESSAGE__
*/
void notifyTG(String msg) {
WiFiClientSecure client;
client.setInsecure();
if (!client.connect("api.telegram.org", 443)) {
Serial.println ("ERROR Connection failed");
return;
}
String req = "GET /bot" + String(TG_TOKEN)
+ "/sendmessage?chat_id=" + String(TG_CHAT_ID)
+ "&text=" + msg
+ " HTTP/1.1\r\n";
req += "Host: api.telegram.org\r\n";
req += "Cache-Control: no-cache\r\n";
req += "User-Agent: ESP8266\r\n";
req += "Connection: close\r\n";
req += "\r\n";
client.print(req);
Serial.print(req);
while (client.connected()) {
String line = client.readStringUntil('\n');
if (line == "\r") {
break;
}
Serial.println(line);
}
}
void notifyLine(String msg) {
WiFiClientSecure client;
client.setInsecure();
if (!client.connect("notify-api.line.me", 443)) {
Serial.println ("ERROR Connection failed");
return;
}
String req = "POST /api/notify HTTP/1.1\r\n";
req += "Host: notify-api.line.me\r\n";
req += "Authorization: Bearer " + String(LINE_TOKEN) + "\r\n";
req += "Cache-Control: no-cache\r\n";
req += "User-Agent: ESP8266\r\n";
req += "Connection: close\r\n";
req += "Content-Type: application/x-www-form-urlencoded\r\n";
req += "Content-Length: " + String(String("message=" + msg).length()) + "\r\n";
req += "\r\n";
req += "message=" + msg;
client.print(req);
Serial.print(req);
while (client.connected()) {
String line = client.readStringUntil('\n');
if (line == "\r") {
// delay(20000);
break;
}
Serial.println(line);
}
}
String readSensor() {
byte checksum = 0;
unsigned char res[MH_Z19B_DATA_LENGTH] = {0,};
int avail = 0;
int count = 0;
_serial.flush();
_serial.write(_cmd, MH_Z19B_DATA_LENGTH);
delay(400);
while(_serial.available() &&
_serial.read() != MH_Z19B_CMD &&
_serial.peek() != MH_Z19B_RES ) {
}
if ( _serial.available() >= MH_Z19B_DATA_LENGTH-1 ) {
res[0] = MH_Z19B_CMD;
for (int j=1;j<MH_Z19B_DATA_LENGTH; j++) {
res[j] = _serial.read();
// Serial.printf("%2X ",res[j]);
if ( j < MH_Z19B_DATA_LENGTH-1 )
checksum += res[j];
}
// Serial.println();
checksum = 0xFF - checksum;
checksum++;
if (res[8] == checksum) {
// uptime = (millis()-startupMillis)/1000;
_co2 = makeWord(res[2],res[3]);
if ( _co2 <= 430 && uptime < 65 ) {
status = "preheating";
} else {
status = "measuring";
}
_temp = res[4]-40;
Serial.printf("CO2:%4d TEMP:%2d ELAPSED:%d Seconds STATUS:%s\n", _co2,
_temp,
uptime,
status.c_str());
} else {
Serial.printf("Error: CMD:%X RES:%X Checksum:%X:%X\n", res[0], res[1], checksum, res[8]);
}
} else {
Serial.println("Not ready");
}
return String(_co2);
}
void setup()
{
startupMillis = millis();
Serial.begin(115200); // For debugging
_serial.begin(9600); // For communicating with MH_Z19B sensor
Serial.printf("\nCO2 air quality monitoring system using MH-Z19B sensor with WIFI, WEBSERVER, LINE NOTIFY\n");
Serial.printf("CO2 notify level:%d Waiting time:%d seconds\n",notifyLevel, notifyInterval/1000);
// Initialize filesystem
if(!SPIFFS.begin()){
Serial.println("ERROR SPIFFS failed");
return;
}
connectWifi(); // Connect to WiFi
String msg="C02 sensor http://"+WiFi.localIP().toString();
// notifyLine(msg);
notifyTG(msg);
server.on("/", HTTP_GET, [](AsyncWebServerRequest *request){
// request->send(SPIFFS, "/index.html", String(), false, templateHandler);
request->send(SPIFFS, "/index.html", "text/html");
});
server.on("/style.css", HTTP_GET, [](AsyncWebServerRequest *request){
request->send(SPIFFS, "/style.css", "text/css");
});
server.on("/script.js", HTTP_GET, [](AsyncWebServerRequest *request){
request->send(SPIFFS, "/script.js", "text/javascript");
});
server.on("/line_logo.png", HTTP_GET, [](AsyncWebServerRequest *request){
request->send(SPIFFS, "/line_logo.png", "image/png");
});
/**
* Send measured data back to client
* Data format : CO2
* Example : 500
*/
server.on("/updatesensorreading", HTTP_GET, [](AsyncWebServerRequest *request){
String ret;
ret = "{\"status\":\"" + status + "\",";
if ( status != "measuring" ) {
ret += "\"readystatus\":" + String(uptime*100/70) +",";
}
ret += "\"co2\":" + String(_co2) + ","
+"\"temp\":" + String(_temp) + ","
+"\"uptime\":" + String(uptime) + "}";
Serial.println(ret);
request->send_P(200, "application/json", ret.c_str());
});
server.begin();
}
void loop()
{
unsigned long currentMillis = 0;
unsigned long currentMeasuringMillis = 0;
if (_co2 >= notifyLevel && !waitFlag) {
String msg = "CO2 level is ";
Serial.printf("CO2: %d\n",_co2);
msg += String(_co2);
// notifyLine(msg);
notifyTG(msg);
waitFlag = true;
previousMillis = millis();
}
if (waitFlag) {
currentMillis = millis();
if ( currentMillis - previousMillis >= notifyInterval ) {
waitFlag = false;
previousMillis = currentMillis;
}
}
currentMeasuringMillis = millis();
if ( currentMeasuringMillis - measuringMillis > measuringInterval ) {
readSensor();
measuringMillis = currentMeasuringMillis;
}
uptime = (millis()-startupMillis)/1000;
}
view raw gistfile1.txt hosted with ❤ by GitHub
Step 4. Upload data to Wemos D1 mini

This step is to upload web server related files (HTML, Javascript, CSS) to Wemos. These files are located in directory named data. Click "ESP8266 Sketch Data Upload" under Tools menu in Arduino IDE to upload these files to Wemos. Once it shows the measurement data, it will refresh every 3 seconds automatically.

HTML file

On web interface, the size of gauge is defined in width, height of options variable. Just change these values to customize chart size. And if you want to modify refresh rate, change the value of 30000 in setInterval function to other value.

<!-- Air quality monitoring system using MH_Z19B sensor with WIFI, WEBSERVER
Hardware : Wemos D1 mini, MH_Z19B
Software : Arduino IDE, EPS8266 Sketch Data Upload
Library : ESPAsyncTCP, ESPAsyncWebServer -->
<!DOCTYPE html>
<html>
<head>
<title>Air quality monitor</title>
<meta name="viewport" content="width=device-width, initial-scale=1">
<meta name="mobile-web-app-capable" content="yes">
<link rel="stylesheet" type="text/css" href="style.css">
<script src="https://www.gstatic.com/charts/loader.js"></script>
<script src="script.js"></script>
</head>
<body onload="startClock()">
<h1>CO2 Sensor</h1>
<div id="clock_div"></div>
<div>
<div id="status_div">Status:</div>
<progress id="progress" value=0 max=100></progress>
</div>
<div class="gauge" id="chart_div"></div>
<div id="line_chart_div"></div>
</body>
</html>
view raw gistfile1.txt hosted with ❤ by GitHub
CSS file

/* Air quality monitoring system using MH_Z19B sensor with WIFI, WEBSERVER
Hardware : Wemos D1 mini, MH_Z19B
Software : Arduino IDE, EPS8266 Sketch Data Upload
Library : ESPAsyncTCP, ESPAsyncWebServer */
html {
font-family: monospace;
}
h1 {
font-size:32px;
}
body {
text-align: center;
/* background-image: url("line_logo.png");
background-repeat: no-repeat; */
}
div {
align-content: center;
margin: 0 auto;
}
.gauge {
display: grid;
margin: 0 auto;
}
#clock_div {
/* font-size:27px; */
}
progress {
-webkit-appearance: none;
height: 2px;
vertical-align: super;
}
progress::-webkit-progress-bar {
background-color: #FFFFFF;
}
progress::-webkit-progress-value {
background-color: #90EE90;
}
view raw gistfile1.txt hosted with ❤ by GitHub

Javascript file

google.charts.load('current', {'packages':['gauge','corechart']});
// Display clock above air quality gauge
function startClock() {
var now = new Date();
var hour = now.getHours();
var minute = now.getMinutes();
var second = now.getSeconds();
minute = minute < 10 ? "0" + minute : minute;
second = second < 10 ? "0" + second : second;
document.getElementById("clock_div").innerHTML =
hour + ":" + minute + ":" + second;
var tmp = setTimeout(startClock, 500);
}
google.charts.setOnLoadCallback(drawChart);
function drawChart() {
var data = google.visualization.arrayToDataTable([
['Label', 'Value'],
['CO2', 0]
]);
var options = {
redFrom: 2000, redTo: 5000,
yellowFrom:1000, yellowTo: 1999,
greenFrom:0, greenTo: 999,
max: 5000,
minorTicks: 10,
majorTicks: ["0","1000","2000","3000","4000","5000"]
};
var chart = new google.visualization.Gauge(document.getElementById('chart_div'));
chart.draw(data, options);
var data2 = google.visualization.arrayToDataTable([
['Time', 'CO2'],
['0', 0]]);
var options2 = {
title: 'CO2 density',
hAxis: {textPosition: 'none'},
vAxis: {title:'PPM', viewWindow: {min:0,max:3000}},
legend: { position: 'bottom' }
};
var chart2 = new google.visualization.LineChart(document.getElementById('line_chart_div'));
chart2.draw(data2, options2);
var n=1;
setInterval(function ( ) {
var xhttp = new XMLHttpRequest();
xhttp.onreadystatechange = function() {
if (this.readyState == 4 && this.status == 200) {
var obj = JSON.parse(this.responseText);
var pms = obj.co2;
console.log(obj);
if ( obj.status != "measuring" ) {
document.getElementById("progress").style.visibility = "visible";
document.getElementById("progress").setAttribute("value", obj.readystatus);
} else {
document.getElementById("progress").style.visibility = "hidden";
}
document.getElementById('status_div').innerHTML = "Status: "+obj.status;
data.setValue(0, 1, pms);
chart.draw(data, options);
// data2.addRow([n.toString(), parseInt(pms)]);
data2.addRow([Date().toString(), parseInt(pms)]);
chart2.draw(data2, options2);
n++;
}
};
xhttp.timeout = 2000;
xhttp.ontimeout = function() {
document.getElementById('status_div').innerHTML = "Status: disconnected";
}
xhttp.open("GET", "/updatesensorreading", true);
xhttp.send();
}, 3000 );
}
view raw script.js hosted with ❤ by GitHub

Results


After uploading firmware, Wemos restarts itself automatically. Once Wemos D1 mini has restarted, serial monitor shows a welcome message, CO2 threshold, and waiting period. When CO2 is higher than threshold it will send Telegram notification to the user as below.


In this project, Wemos sends two types of message. The first type is for informing IP address of itself.  And the second type is for notification with measured CO2 density.


We can use web browser to connect to the device, then it will show current time and visualized information, which is based on Google Chart API. It will refresh itself every 3 seconds automatically.


Cautious!


In this project, Wemos uses softwareserial library to communicate with MH-Z19B sensor. However,  this library will be interfered by other library which uses timer or interrupt internally. Originally, I plant to use Adafruit Neopixel library in this project to lit some of LED strip, but, it interfered the communication of softwareserial library. So, I decided not to use LED strip for this project. One possible work around would be to ESP32 board which has more than one hardware serial.

References


- MH-Z19B Manual PDF: mh-z19b-co2-ver1_0.pdf
MHZ19 - RevSpace
Source codes at github

Monday, February 10, 2020

CO2 air quality monitor with Line notification V2

Introduction


This is an updated version of previous project IoT Laboratory: CO2 air quality monitor with Line notification.


Why?


After cold start, it takes about 65 seconds for MH_Z19B to preheat itself. During this period, the reading will be somewhere between 410 and 430, but, it should not be considered as an actual measurement. Once preheating period has finished, it starts showing actual CO2 density. Therefore, it is recommended to read sensor after 65 seconds at least. For your reference, according to the manual, preheating time is 3 minutes.


What's changed


- Display current status: Preheating, Measuring
- Add line chart on web interface

Source code


/**
* CO2 air quality monitoring system using MH_Z19B sensor with WIFI, WEBSERVER, LINE NOTIFY
*
* Hardware : Wemos D1 mini, MH_Z19B
* Software : Arduino IDE, EPS8266 Sketch Data Upload
* Library : ESPAsyncTCP, ESPAsyncWebServer
*
* Cautious!
* After cold start, it takes about 65 seconds for MH_Z19B to preheat itself. During this period,
* the reading will be somewhere between 410 and 430. But, after preheating period, it starts showing
* actual CO2 density. Therefore, it is recommended to read sensor after 65 seconds at least.
*
* MH-Z19B Manual:
* https://www.winsen-sensor.com/d/files/infrared-gas-sensor/mh-z19b-co2-ver1_0.pdf
* LINE API Reference :
* https://engineering.linecorp.com/en/blog/using-line-notify-to-send-messages-to-line-from-the-command-line/
*
* January 2020. Brian Kim
*/
#include <SoftwareSerial.h>
#include <ESP8266WiFi.h>
#include <ESPAsyncTCP.h>
#include <ESPAsyncWebServer.h>
#include <FS.h>
#include <WiFiClientSecureAxTLS.h>
/**
* WiFi credentials
*/
#define WIFI_SSID "your-ssid"
#define WIFI_PASS "your-password"
/**
* LINE Notify credential
*/
#define LINE_TOKEN "your-line-token"
/**
* MH_Z19B sensor pin map and command packet
*/
#define MH_Z19B_TX D5 // GPIO12
#define MH_Z19B_RX D6 // GPIO14
#define MH_Z19B_CMD 0xFF
#define MH_Z19B_RES 0x86
#define MH_Z19B_DATA_LENGTH 9
byte _cmd[MH_Z19B_DATA_LENGTH] = {MH_Z19B_CMD,0x01,MH_Z19B_RES,0x00,0x00,0x00,0x00,0x00,0x79};
/**
* Wemos serial RX - TX MH_Z19B
* TX - RX
*/
SoftwareSerial _serial(MH_Z19B_TX, MH_Z19B_RX); // RX, TX
AsyncWebServer server(80);
int _co2;
unsigned long previousMillis = 0;
const long notifyInterval = 600000; // Waiting time(milliseconds)
const int notifyLevel = 1000; // CO2 threshold for notification
bool waitFlag = false;
/**
* Preheating timing
*/
unsigned long startupMillis = 0;
/**
* Measuring interval
*/
unsigned long measuringMillis = 0;
const long measuringInterval = 5000; // Waiting time(milliseconds)
void connectWifi() {
WiFi.mode(WIFI_STA);
WiFi.begin(WIFI_SSID, WIFI_PASS);
while (WiFi.status() != WL_CONNECTED) {
delay(500);
Serial.print(".");
}
Serial.println("");
Serial.println("WiFi connected");
Serial.print("IP address: ");
Serial.println(WiFi.localIP());
}
void notifyLine(String msg) {
WiFiClientSecure client;
client.setInsecure();
if (!client.connect("notify-api.line.me", 443)) {
Serial.println ("ERROR Connection failed");
return;
}
String req = "POST /api/notify HTTP/1.1\r\n";
req += "Host: notify-api.line.me\r\n";
req += "Authorization: Bearer " + String(LINE_TOKEN) + "\r\n";
req += "Cache-Control: no-cache\r\n";
req += "User-Agent: ESP8266\r\n";
req += "Connection: close\r\n";
req += "Content-Type: application/x-www-form-urlencoded\r\n";
req += "Content-Length: " + String(String("message=" + msg).length()) + "\r\n";
req += "\r\n";
req += "message=" + msg;
client.print(req);
Serial.print(req);
while (client.connected()) {
String line = client.readStringUntil('\n');
if (line == "\r") {
// delay(20000);
break;
}
Serial.println(line);
}
}
String readSensor() {
byte checksum = 0;
unsigned char res[MH_Z19B_DATA_LENGTH] = {0,};
int avail = 0;
int count = 0;
_serial.flush();
_serial.write(_cmd, MH_Z19B_DATA_LENGTH);
delay(400);
while(_serial.available() &&
_serial.read() != MH_Z19B_CMD &&
_serial.peek() != MH_Z19B_RES ) {
}
if ( _serial.available() >= MH_Z19B_DATA_LENGTH-1 ) {
res[0] = MH_Z19B_CMD;
for (int j=1;j<MH_Z19B_DATA_LENGTH; j++) {
res[j] = _serial.read();
// Serial.printf("%2X ",res[j]);
if ( j < MH_Z19B_DATA_LENGTH-1 )
checksum += res[j];
}
// Serial.println();
checksum = 0xFF - checksum;
checksum++;
if (res[8] == checksum) {
String status;
unsigned long uptime = (millis()-startupMillis)/1000;
_co2 = makeWord(res[2],res[3]);
if ( _co2 <= 430 && uptime < 65000 ) {
status = "Preheating";
} else {
status = "Measuring";
}
Serial.printf("CO2:%4d TEMP:%2d ELAPSED:%d Seconds STATUS:%s\n", _co2,
res[4]-44,
uptime,
status.c_str());
} else {
Serial.printf("Error: CMD:%X RES:%X Checksum:%X:%X\n", res[0], res[1], checksum, res[8]);
}
} else {
Serial.println("Not ready");
}
return String(_co2);
}
void setup()
{
startupMillis = millis();
Serial.begin(115200); // For debugging
_serial.begin(9600); // For communicating with MH_Z19B sensor
Serial.printf("\nCO2 air quality monitoring system using MH-Z19B sensor with WIFI, WEBSERVER, LINE NOTIFY\n");
Serial.printf("CO2 notify level:%d Waiting time:%d seconds\n",notifyLevel, notifyInterval/1000);
// Initialize filesystem
if(!SPIFFS.begin()){
Serial.println("ERROR SPIFFS failed");
return;
}
connectWifi(); // Connect to WiFi
String msg="C02 sensor http://"+WiFi.localIP().toString();
// notifyLine(msg);
server.on("/", HTTP_GET, [](AsyncWebServerRequest *request){
// request->send(SPIFFS, "/index.html", String(), false, templateHandler);
request->send(SPIFFS, "/index.html", "text/html");
});
server.on("/style.css", HTTP_GET, [](AsyncWebServerRequest *request){
request->send(SPIFFS, "/style.css", "text/css");
});
server.on("/line_logo.png", HTTP_GET, [](AsyncWebServerRequest *request){
request->send(SPIFFS, "/line_logo.png", "image/png");
});
/**
* Send measured data back to client
* Data format : CO2
* Example : 500
*/
server.on("/updatesensorreading", HTTP_GET, [](AsyncWebServerRequest *request){
request->send_P(200, "text/plain", String(_co2).c_str());
});
server.begin();
}
void loop()
{
unsigned long currentMillis = 0;
unsigned long currentMeasuringMillis = 0;
if (_co2 >= notifyLevel && !waitFlag) {
String msg = "CO2 level is ";
Serial.printf("CO2: %d\n",_co2);
msg += String(_co2);
// notifyLine(msg);
waitFlag = true;
previousMillis = millis();
}
if (waitFlag) {
currentMillis = millis();
if ( currentMillis - previousMillis >= notifyInterval ) {
waitFlag = false;
previousMillis = currentMillis;
}
}
currentMeasuringMillis = millis();
if ( currentMeasuringMillis - measuringMillis > measuringInterval ) {
readSensor();
measuringMillis = currentMeasuringMillis;
}
}

References


- MH-Z19B Manual PDF: mh-z19b-co2-ver1_0.pdf
Source codes at github

Saturday, February 8, 2020

CO2 air quality monitor with Line notification

Introduction


CO2 Air Quality Monitoring System with Line notification


Purpose


The aim of this project is to receive Line notification when CO2 air quality is higher than certain level from Wemos. It uses MH-Z19B sensor to measure CO2 air quality and visualizes the result with Google Chart API. CO2 measurement data is presented in gauge type. We can check current status via web browser using WiFi connection.

Features


This project is based on our previous project named "IoT Laboratory: Send Line notification from ESP8266 when PM2.5 is too high" It replaces air quality sensor with CO2 sensor.  A user will be notified by Line when the level of CO2 hits a certain level which is specified by the user in the source code. The entire process for sending Line notification is like below. Wemos sends HTTP POST request to Line Notify website, then, the message will be delivered to our Line messenger.


For web server, we use ESPAsyncWebServer library and it is available at github. Additionally, we need to install EPS8266 Sketch Data Upload to upload web server related files to Wemos. For example, in this project, we use HTML, CSS files under data directory. In other words, we need to upload sketch and web related files separately.

Prerequisites


- Arduino IDE
ESP8266 package for Arduino IDE
EPS8266 Sketch Data Upload
ESPAsyncTCP Library
ESPAsyncWebServer Library
- Line account and Token

Requirements


Hardware
-Wemos D1 mini : US$1.77 on Aliexpress
-MH-Z19B CO2 sensor : US$17.90 on Aliexpress

Instructions


Step 1. Setup hardware

MH-Z19B sensor has many pins, but, we only use TX, RX, VCC, and GND pins. Connect TX of MH-Z19B to D5 of Wemos, RX to D6, VCC to 5V, and GND to G. Finally, connect micro usb to Wemos for uploading firmware, and check serial monitor and serial plotter in Android IDE to make sure the sensor works correctly.


Step 2. Create Line account and Token for notification

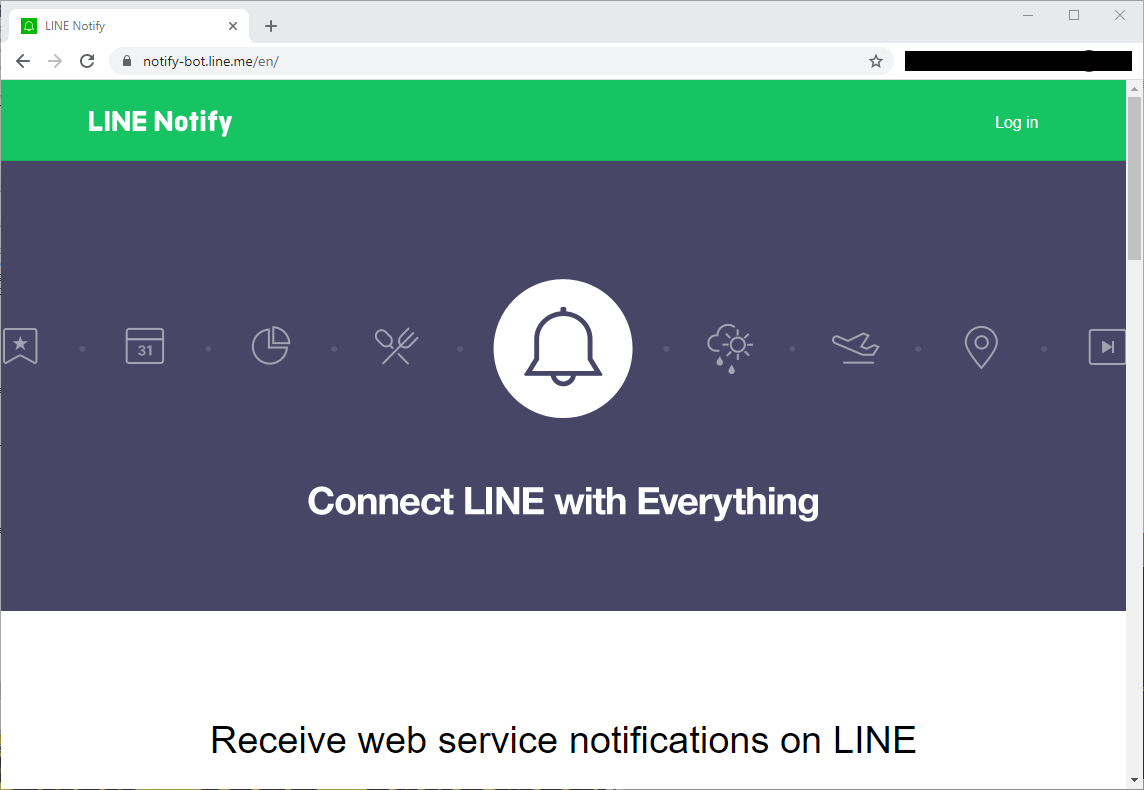
To be able to receive Line notification, we need to get a token from Line Notify website and put it in our source sketch. Useful tutorial on how to create a token is available at https://engineering.linecorp.com/en/blog/using-line-notify-to-send-messages-to-line-from-the-command-line/. Take a good look at it to understand basic procedure to create a token.

First, login to the LINE Notify website


Click "My page"


Click "Generate token"


Important! Then, type any name for the token and choose who will receive Line notification. We can choose a single recipient or group. For testing purpose, let's choose myself here, then it will send notification only to me.

Step 3. Upload sketch to Wemos D1 mini

This step is to upload sketch to Wemos as usual. In the following sketch, following values need to be modified with your own.

WIFI_SSID  : Name of WiFi router
WIFI_PASS  Password of WiFi router
LINE_TOKEN : Token string from Line Notify website

In this example sketch, it send Line notification only when CO2 density hit 1000 or higher. And before sending again it waits 10 minutes. These values can be changed by user.

notifyLevel    : CO2 threshold for Line notification
- notifyInterval : Waiting time (specify in milliseconds)


/**
* CO2 air quality monitoring system using MH_Z19B sensor with WIFI, WEBSERVER, LINE NOTIFY
*
* Hardware : Wemos D1 mini, MH_Z19B
* Software : Arduino IDE, EPS8266 Sketch Data Upload
* Library : ESPAsyncTCP, ESPAsyncWebServer
*
* MH-Z19B Manual:
* https://www.winsen-sensor.com/d/files/infrared-gas-sensor/mh-z19b-co2-ver1_0.pdf
* LINE API Reference :
* https://engineering.linecorp.com/en/blog/using-line-notify-to-send-messages-to-line-from-the-command-line/
*
* January 2020. Brian Kim
*/
#include <SoftwareSerial.h>
#include <ESP8266WiFi.h>
#include <ESPAsyncTCP.h>
#include <ESPAsyncWebServer.h>
#include <FS.h>
#include <WiFiClientSecureAxTLS.h>
/**
* WiFi credentials
*/
#define WIFI_SSID "your-ssid"
#define WIFI_PASS "your-password"
/**
* LINE Notify credential
*/
#define LINE_TOKEN "your-line-token"
/**
* MH_Z19B sensor pin map and command packet
*/
#define MH_Z19B_TX D5 // GPIO12
#define MH_Z19B_RX D6 // GPIO14
#define MH_Z19B_CMD 0xFF
#define MH_Z19B_RES 0x86
#define MH_Z19B_DATA_LENGTH 9
byte _cmd[MH_Z19B_DATA_LENGTH] = {MH_Z19B_CMD,0x01,0x86,0x00,0x00,0x00,0x00,0x00,0x79};
/**
* Wemos serial RX - TX MH_Z19B
* TX - RX
*/
SoftwareSerial _serial(MH_Z19B_TX, MH_Z19B_RX); // RX, TX
AsyncWebServer server(80);
int _co2;
unsigned long previousMillis = 0;
const long notifyInterval = 600000; // Waiting time(milliseconds)
const int notifyLevel = 1000; // CO2 threshold for notification
bool waitFlag = false;
/**
* Measuring interval
*/
unsigned long measuringMillis = 0;
const long measuringInterval = 2000; // Waiting time(milliseconds)
void connectWifi() {
WiFi.mode(WIFI_STA);
WiFi.begin(WIFI_SSID, WIFI_PASS);
while (WiFi.status() != WL_CONNECTED) {
delay(500);
Serial.print(".");
}
Serial.println("");
Serial.println("WiFi connected");
Serial.print("IP address: ");
Serial.println(WiFi.localIP());
}
void notifyLine(String msg) {
WiFiClientSecure client;
client.setInsecure();
if (!client.connect("notify-api.line.me", 443)) {
Serial.println ("ERROR Connection failed");
return;
}
String req = "POST /api/notify HTTP/1.1\r\n";
req += "Host: notify-api.line.me\r\n";
req += "Authorization: Bearer " + String(LINE_TOKEN) + "\r\n";
req += "Cache-Control: no-cache\r\n";
req += "User-Agent: ESP8266\r\n";
req += "Connection: close\r\n";
req += "Content-Type: application/x-www-form-urlencoded\r\n";
req += "Content-Length: " + String(String("message=" + msg).length()) + "\r\n";
req += "\r\n";
req += "message=" + msg;
client.print(req);
Serial.print(req);
while (client.connected()) {
String line = client.readStringUntil('\n');
if (line == "\r") {
// delay(20000);
break;
}
Serial.println(line);
}
}
String readSensor() {
byte checksum = 0;
unsigned char res[MH_Z19B_DATA_LENGTH] = {0,};
_serial.write(_cmd, MH_Z19B_DATA_LENGTH);
if(_serial.available()) {
_serial.readBytes(res, MH_Z19B_DATA_LENGTH);
}
for (byte i = 1; i < MH_Z19B_DATA_LENGTH - 1; i++) {
// Serial.print(res[i], HEX);Serial.print(" ");
checksum += res[i];
}
// Serial.println("");
checksum = 0xFF - checksum;
checksum++;
if( res[0] == MH_Z19B_CMD &&
res[1] == MH_Z19B_RES &&
res[8] == checksum ) {
_co2 = makeWord(res[2],res[3]);
Serial.printf("CO2:%4d\n",_co2);
} else {
// Serial.println("CRC error: " + String(checksum) + "/"+ String(res[8]));
Serial.printf("Error: CMD:%x RES:%x Checksum:%x:%x\n", res[0], res[1], checksum, res[8]);
}
return String(_co2);
}
void setup()
{
Serial.begin(115200); // For debugging
_serial.begin(9600); // For communicating with MH_Z19B sensor
Serial.printf("\nCO2 air quality monitoring system using MH-Z19B sensor with WIFI, WEBSERVER, LINE NOTIFY\n");
Serial.printf("CO2 notify level:%d Waiting time:%d seconds\n",notifyLevel, notifyInterval/1000);
// Initialize filesystem
if(!SPIFFS.begin()){
Serial.println("ERROR SPIFFS failed");
return;
}
connectWifi(); // Connect to WiFi
server.on("/", HTTP_GET, [](AsyncWebServerRequest *request){
// request->send(SPIFFS, "/index.html", String(), false, templateHandler);
request->send(SPIFFS, "/index.html", "text/html");
});
server.on("/style.css", HTTP_GET, [](AsyncWebServerRequest *request){
request->send(SPIFFS, "/style.css", "text/css");
});
server.on("/line_logo.png", HTTP_GET, [](AsyncWebServerRequest *request){
request->send(SPIFFS, "/line_logo.png", "image/png");
});
/**
* Send measured data back to client
* Data format : CO2
* Example : 500
*/
server.on("/updatesensorreading", HTTP_GET, [](AsyncWebServerRequest *request){
request->send_P(200, "text/plain", String(_co2).c_str());
});
server.begin();
}
void loop()
{
unsigned long currentMillis = 0;
unsigned long currentMeasuringMillis = 0;
if (_co2 >= notifyLevel && !waitFlag) {
String msg = "CO2 level is ";
Serial.printf("CO2: %d\n",_co2);
msg += String(_co2);
notifyLine(msg);
waitFlag = true;
previousMillis = millis();
}
if (waitFlag) {
currentMillis = millis();
if ( currentMillis - previousMillis >= notifyInterval ) {
waitFlag = false;
previousMillis = currentMillis;
}
}
currentMeasuringMillis = millis();
if ( currentMeasuringMillis - measuringMillis > measuringInterval ) {
readSensor();
measuringMillis = currentMeasuringMillis;
}
}
Step 4. Upload data to Wemos D1 mini

This step is to upload web server related files (HTML, CSS) to Wemos. These files are located in directory named data. Click "ESP8266 Sketch Data Upload" under Tools menu in Arduino IDE to upload these files to Wemos. Once it shows the measurement data, it will refresh every 3 seconds automatically.

HTML file

On web interface, the size of gauge is defined in width, height of options variable. Just change these values to customize chart size. And if you want to modify refresh rate, change the value of 30000 in setInterval function to other value.

<!-- Air quality monitoring system using MH_Z19B sensor with WIFI, WEBSERVER
Hardware : Wemos D1 mini, MH_Z19B
Software : Arduino IDE, EPS8266 Sketch Data Upload
Library : ESPAsyncTCP, ESPAsyncWebServer -->
<!DOCTYPE html>
<html>
<head>
<title>Air quality monitor</title>
<meta name="viewport" content="width=device-width, initial-scale=1">
<meta name="mobile-web-app-capable" content="yes">
<link rel="stylesheet" type="text/css" href="style.css">
<script src="https://www.gstatic.com/charts/loader.js"></script>
<script>
google.charts.load('current', {'packages':['gauge','corechart']});
// Display clock above air quality gauge
function startClock() {
var now = new Date();
var hour = now.getHours();
var minute = now.getMinutes();
var second = now.getSeconds();
minute = minute < 10 ? "0" + minute : minute;
second = second < 10 ? "0" + second : second;
document.getElementById("clock_div").innerHTML =
hour + ":" + minute + ":" + second;
var tmp = setTimeout(startClock, 500);
}
</script>
</head>
<body onload="startClock()">
<h1>CO2 air quality monitor</h1>
<div id="clock_div"></div>
<div id="chart_div"></div>
<script>
google.charts.setOnLoadCallback(drawChart);
function drawChart() {
var data = google.visualization.arrayToDataTable([
['Label', 'Value'],
['CO2', 0]
]);
var options = {
width: 800, height: 240,
redFrom: 2000, redTo: 5000,
yellowFrom:1000, yellowTo: 1999,
greenFrom:0, greenTo: 999,
max: 5000,
minorTicks: 10,
majorTicks: ["0","1000","2000","3000","4000","5000"]
};
var chart = new google.visualization.Gauge(document.getElementById('chart_div'));
chart.draw(data, options);
setInterval(function ( ) {
var xhttp = new XMLHttpRequest();
xhttp.onreadystatechange = function() {
if (this.readyState == 4 && this.status == 200) {
var pms = this.responseText.split(" ");
data.setValue(0, 1, this.responseText);
// data.setValue(1, 1, pms[1]);
// data.setValue(2, 1, pms[2]);
chart.draw(data, options);
}
};
xhttp.open("GET", "/updatesensorreading", true);
xhttp.send();
}, 3000 );
}
</script>
</body>
</html>
view raw index.html hosted with ❤ by GitHub
CSS file

/* Air quality monitoring system using MH_Z19B sensor with WIFI, WEBSERVER
Hardware : Wemos D1 mini, MH_Z19B
Software : Arduino IDE, EPS8266 Sketch Data Upload
Library : ESPAsyncTCP, ESPAsyncWebServer */
html {
font-family: monospace;
}
h1 {
font-size:45px;
}
body {
text-align: center;
background-image: url("line_logo.png");
background-repeat: no-repeat;
}
div {
display: table;
margin: 0 auto;
}
#clock_div {
font-size:27px;
}
view raw style.css hosted with ❤ by GitHub

Results


After uploading firmware, Wemos restarts itself automatically. Once Wemos D1 mini has restarted, serial monitor shows a welcome message, CO2 threshold, and waiting period. When CO2 is higher than threshold it will send Line notification to the user as below.


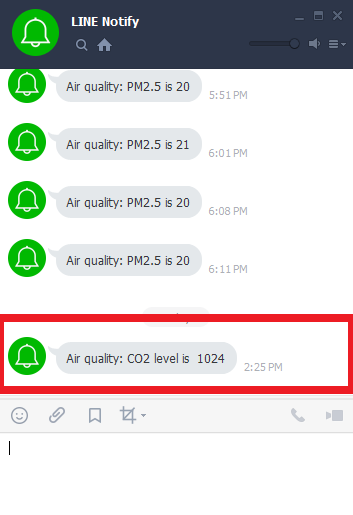
One Wemos sends notification, Line messenger will show you the content of it as below. Notice that "Air quality" in the message is actually the token name we typed when the token was created.


We can use web browser to connect to the device, then it will show current time and visualized information, which is based on Google Chart API. It will refresh itself every 3 seconds automatically.


Cautious!


In this project, Wemos uses softwareserial library to communicate with MH-Z19B sensor. However,  this library will be interfered by other library which uses timer or interrupt internally. Originally, I plant to use Adafruit Neopixel library in this project to lit some of LED strip, but, it interfered the communication of softwareserial library. So, I decided not to use LED strip for this project. One possible work around would be to ESP32 board which has more than one hardware serial.

References


- MH-Z19B Manual PDF: mh-z19b-co2-ver1_0.pdf
Source codes at github

Thursday, February 6, 2020

Control ESP8266 with Google Assistant. OK GOOGLE TURN ON THE LIGHT!

Introduction


Voice control ESP8266 with Google Assistant


Purpose


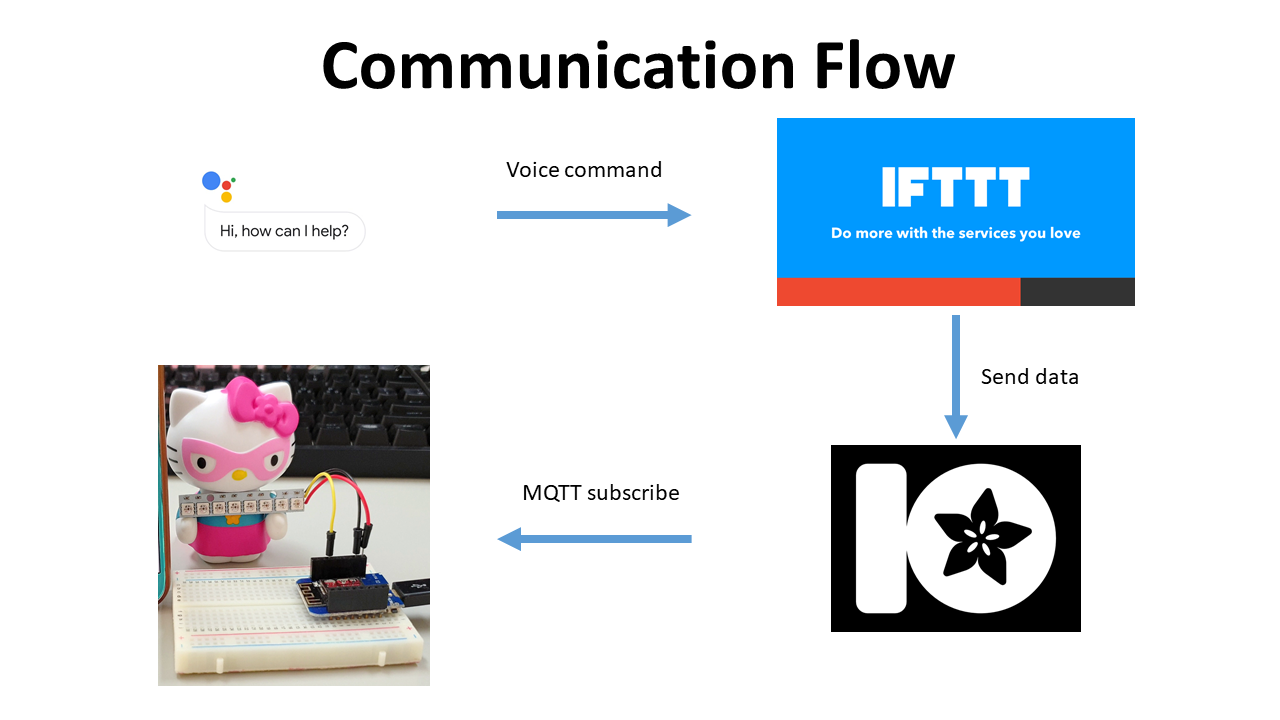
The aim of this project is to voice control ESP8266 with Google Assistant. We talk to Google Assistant app. Once Google Assistant hear our voice command, it will communicate with IFTTT. Then, IFTTT forwards command to Adafruit MQTT broker. Finally, ESP8266 receives the command through MQTT subscribe function and executes it.

Features


This project requires multiple services to complete the mission. First, it requires Google Assistant app on your phone. Then, we need to create IFTTT account and Adafruit MQTT broker account. In IFTTT, create an applet to link Google Assistant and MQTT broker, so, IFTTT can forward our command from Google Assistant to MQTT broker. Wemos receives a messge from MQTT broker using subscribe function. The whole communication flow looks like this,


Prerequisites


- Arduino IDE
ESP8266 package for Arduino IDE
EPS8266 Sketch Data Upload
IFTTT
- Adafruit MQTT broker
Adafruit_NeoPixel Library for controlling single-wire LED pixels (NeoPixel, WS2812, etc.)

Requirements


Hardware
- Wemos D1 mini : US$1.77 on Aliexpress
- NeoPixel compatible LED stick: https://www.adafruit.com/product/1426

Instructions


Step 1. Setup hardware

Normally, LED stick has VCC, GND, DATA pin. Wiring is very simple, just connect DATA of LED stick to D1 of Wemos.


Step 2. Create IFTTT account and Adafruit MQTT account

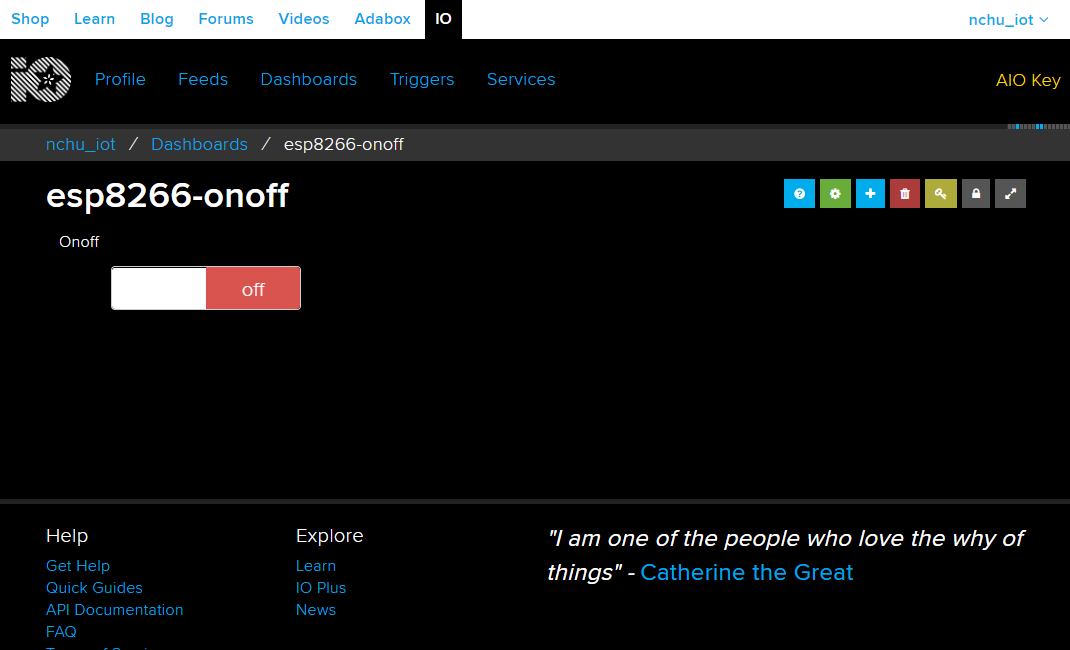
After creating Adafruit MQTT account, create a "feed" and dashboard for it just like this. We are going to use this dashboard to test communication between Wemos and MQTT broker later.


Useful tutorial about how to create a "feed" on MQTT broker is available here https://learn.adafruit.com/adafruit-io-basics-digital-output?view=all

Then, create two applets on IFTTT, one is for "turning off the light" and the other is for "turning on the light". Useful tutorial is here https://www.electronicwings.com/nodemcu/control-home-appliances-using-google-assistant

Step 3. Upload sketch to Wemos D1 mini

This step is to upload sketch to Wemos as usual. In the following sketch, following values need to be modified with your own.

WIFI_SSID    : Name of WiFi router
WIFI_PASS    Password of WiFi router
- AIO_USERNAME : Value of 'IO_USERNAME' of MQTT broker
- AIO_KEY      : Value of 'IO_KEY' of the MQTT broker

/**
* Controlling ESP8266 with Google Assistant
*
* Hardware : Wemos D1 mini, LED strip
* Software : Arduino IDE, Adafruit MQTT Library, Adafruit NeoPixel Library
*
* LED control functions are from
* https://github.com/adafruit/Adafruit_NeoPixel/blob/master/examples/RGBWstrandtest/RGBWstrandtest.ino
*
* January 2020. Brian Kim
*/
#include <ESP8266WiFi.h>
#include "Adafruit_MQTT.h"
#include "Adafruit_MQTT_Client.h"
#include <Adafruit_NeoPixel.h>
/**
* WiFi credentials
*/
#define WIFI_SSID "your-ssid"
#define WIFI_PASS "your-password"
/**
* MQTT broker credentials
*/
#define AIO_SERVER "io.adafruit.com"
#define AIO_SERVERPORT 1883 // use 8883 for SSL
#define AIO_USERNAME "...your AIO username (see https://accounts.adafruit.com)..."
#define AIO_KEY "...your AIO key..."
/**
* From Adafruit NeoPixel example
*/
#define LED_PIN D1
#define LED_COUNT 8
#define BRIGHTNESS 50
Adafruit_NeoPixel strip(LED_COUNT, LED_PIN, NEO_GRBW + NEO_KHZ800);
WiFiClient client;
Adafruit_MQTT_Client mqtt(&client, AIO_SERVER, AIO_SERVERPORT, AIO_USERNAME, AIO_KEY);
Adafruit_MQTT_Subscribe onoffbutton = Adafruit_MQTT_Subscribe(&mqtt, AIO_USERNAME "/feeds/onoff");
void setup() {
Serial.begin(115200); // For debugging
Serial.printf("\nControlling ESP8266 with Google Assistant via IFTTT, MQTT\n");
connectWifi(); // Connect to WiFi
strip.begin(); // INITIALIZE NeoPixel strip object (REQUIRED)
// strip.show(); // Turn OFF all pixels ASAP
turnOff();
strip.setBrightness(50); // Set BRIGHTNESS to about 1/5 (max = 255)
mqtt.subscribe(&onoffbutton);
}
void loop() {
connectMQTT();
Adafruit_MQTT_Subscribe *subscription;
while ((subscription = mqtt.readSubscription(5000))) {
if (subscription == &onoffbutton) {
Serial.print(F("Received command: "));
Serial.println((char *)onoffbutton.lastread);
String command = String((char *)onoffbutton.lastread);
if ( command.equals("on") ) {
Serial.println("Turn on the light");
turnOn();
} else if (command.equals("off")) {
Serial.println("Turn off the light");
turnOff();
}
}
}
// if(!mqtt.ping()) {
// mqtt.disconnect();
// }
}
void turnOff() {
strip.clear();
strip.show(); // Turn OFF all pixels ASAP
}
void turnOn() {
colorWipe(strip.Color(255, 0, 0) , 50); // Red
colorWipe(strip.Color( 0, 255, 0) , 50); // Green
colorWipe(strip.Color( 0, 0, 255) , 50); // Blue
colorWipe(strip.Color( 0, 0, 0, 255), 50); // True white (not RGB white)
// whiteOverRainbow(75, 5);
// pulseWhite(5);
// rainbowFade2White(3, 3, 1);
}
void connectWifi() {
WiFi.mode(WIFI_STA);
WiFi.begin(WIFI_SSID, WIFI_PASS);
while (WiFi.status() != WL_CONNECTED) {
delay(500);
Serial.print(".");
}
Serial.println("");
Serial.println("WiFi connected");
Serial.print("IP address: ");
Serial.println(WiFi.localIP());
}
/**
* From https://github.com/adafruit/Adafruit_MQTT_Library/blob/master/examples/mqtt_esp8266/mqtt_esp8266.ino
*/
void connectMQTT() {
int8_t ret;
// Stop if already connected.
if (mqtt.connected()) {
return;
}
Serial.print("Connecting to MQTT... ");
uint8_t retries = 3;
while ((ret = mqtt.connect()) != 0) { // connect will return 0 for connected
Serial.println(mqtt.connectErrorString(ret));
Serial.println("Retrying MQTT connection in 5 seconds...");
mqtt.disconnect();
delay(5000); // wait 5 seconds
retries--;
if (retries == 0) {
// basically die and wait for WDT to reset me
while (1);
}
}
Serial.println("MQTT Connected!");
}
void colorWipe(uint32_t color, int wait) {
for(int i=0; i<strip.numPixels(); i++) { // For each pixel in strip...
strip.setPixelColor(i, color); // Set pixel's color (in RAM)
strip.show(); // Update strip to match
delay(wait); // Pause for a moment
}
}

Results


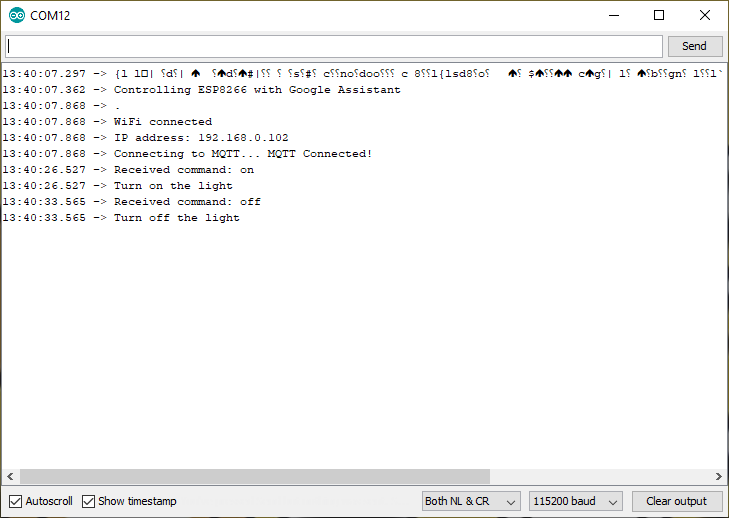
After uploading firmware, Wemos restarts itself automatically. Once Wemos D1 has restarted, serial monitor shows a welcome message and IP address of Wemos. It displays detail about the command whenever it receives new one. In this example, there are two different commands; on and off.


Right after upload sketch, it is recommended to test whether Wemos is working with MQTT broker without problem by clicking onoff switch on MQTT broker dashboard. It would be good news if console message shows the correct command whenever you click the switch on dashboard.


After confirming above step, now it is time to test the system altogether.


References


Source codes at github

Wednesday, February 5, 2020

homebridge [rpi camera] ffmpeg exited with code 1

Homebridge, Raspberry Pi camera, HomeKit


Installing homebridge on Raspberry Pi seems to be easy if we follow tutorials like nfarina/homebridge: HomeKit support for the impatient and Running Homebridge on a Raspberry Pi · nfarina/homebridge Wiki.

But, once we finish all the processes and setup systemd configuration, then hit this command to run homebridge in background.

$ sudo systemctl start homebridge.service

Then, some of you may encounter error like this,

And we use following command to check the status of service.

$ sudo systemctl status home-assistant@homeassistant.service

We may see error like this,

[rpi camera] ffmpeg exited with code 1


How to fix this error is really simple. If we have followed tutorials mentioned above, then we already created a user homebridge. 

Run the following command to add user homebridge to the video group.

$ sudo usermod -a -G video homebridge

 then, restart homebridge.

If homebridge failss even earlier, take a look at the location of homebridge binary. In /etc/systemd/system/homebridge.service in tutorial, it says /usr/local/bin/homebridge, but, somehow, it is located in /usr/bin/homebridge in my case. So, I modified it in /etc/systemd/system/homebridge.service

[Unit]
Description=Node.js HomeKit Server
After=syslog.target network-online.target

[Service]
Type=simple
User=homebridge
EnvironmentFile=/etc/default/homebridge
# Adapt this to your specific setup (could be /usr/bin/homebridge)
# See comments below for more information
#ExecStart=/usr/local/bin/homebridge $HOMEBRIDGE_OPTS
ExecStart=/usr/bin/homebridge $HOMEBRIDGE_OPTS
Restart=on-failure
RestartSec=10
KillMode=process

[Install]
WantedBy=multi-user.target

References


Tuesday, February 4, 2020

Send Line notification from ESP8266 when PM2.5 is too high

Introduction


Low-cost (US$19) Air Quality Monitoring System with Line notification


Purpose


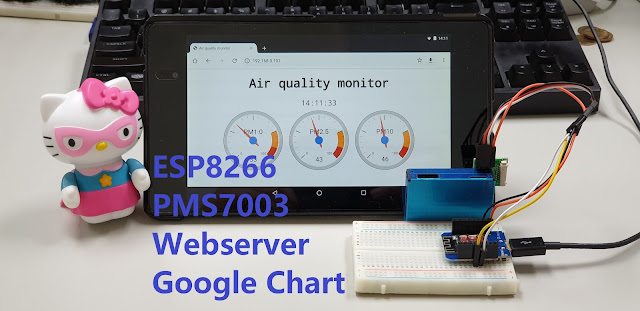
The aim of this project is to receive Line notification when air quality is higher than certain level from Wemos. It uses PMS7003 sensor to measure air quality and visualizes the result with Google Chart API. Air quality measurement data is presented in gauge type. We can check current status via web browser using WiFi connection.

Features


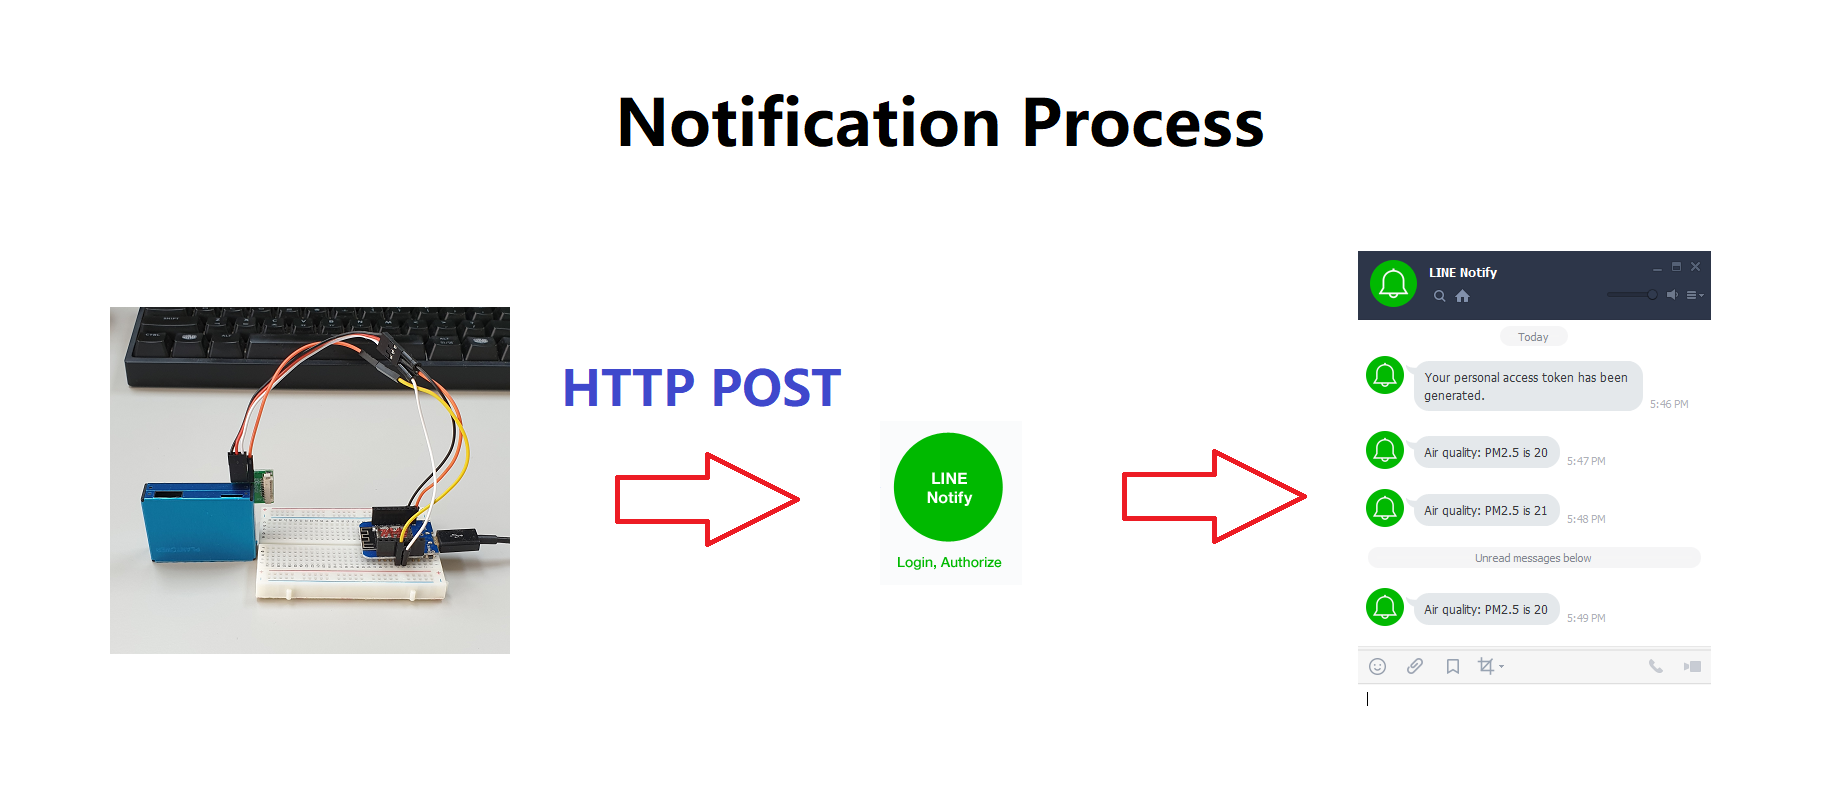
This project is based on our previous project named "IoT Laboratory: ESP8266-based WiFi air quality monitoring system using PMS7003 sensor with Google Chart visualization." It adds Line notification functionality to notify user when the level of air quality hits a certain level which is specified by the user in the source code. The entire process for sending Line notification is like below. Wemos sends HTTP POST request to Line Notify website, then, the message will be delivered to our Line messenger.


For web server, we use ESPAsyncWebServer library and it is available at github. Additionally, we need to install EPS8266 Sketch Data Upload to upload web server related files to Wemos. For example, in this project, we use HTML, CSS files under data directory. In other words, we need to upload sketch and web related files separately.

Prerequisites


- Arduino IDE
ESP8266 package for Arduino IDE
EPS8266 Sketch Data Upload
ESPAsyncTCP Library
ESPAsyncWebServer Library
- Line account and Token

Requirements


Hardware
-Wemos D1 mini : US$1.77 on Aliexpress
-PMS7003 air quality sensor : US$16.80 on Aliexpress

Instructions


Step 1. Setup hardware

PMS7003 sensor comes with a small breakout board, which has TX, RX, VCC, GND pins. Connect TX of PMS7003 to D5 of Wemos, RX to D6, VCC to 5V, and GND to G. Finally, connect micro usb to Wemos for uploading firmware, and check serial monitor and serial plotter in Android IDE to make sure the sensor works correctly.


Step 2. Create Line account and Token for notification

To be able to receive Line notification, we need to get a token from Line Notify website and put it in our source sketch. Useful tutorial on how to create a token is available at https://engineering.linecorp.com/en/blog/using-line-notify-to-send-messages-to-line-from-the-command-line/. Take a good look at it to understand basic procedure to create a token.

First, login to the LINE Notify website


Click "My page"


Click "Generate token"


Important! Then, type any name for the token and choose who will receive Line notification. We can choose a single recipient or group. For testing purpose, let's choose myself here, then it will send notification only to me.

Step 3. Upload sketch to Wemos D1 mini

This step is to upload sketch to Wemos as usual. In the following sketch, following values need to be modified with your own.

WIFI_SSID  : Name of WiFi router
WIFI_PASS  Password of WiFi router
LINE_TOKEN : Token string from Line Notify website

In this example sketch, it send Line notification only when PM2.5 hit 20 or higher. And before sending again it waits 10 minutes. These values can be changed by user.

notifyLevel : PM2.5 threshold for Line notification
interval    : Waiting time (specify in milliseconds)


/**
* Air quality monitoring system using PMS7003 sensor with WIFI, WEBSERVER, LINE NOTIFY
*
* Hardware : Wemos D1 mini, PMS7003
* Software : Arduino IDE, EPS8266 Sketch Data Upload
* Library : ESPAsyncTCP, ESPAsyncWebServer
*
* LINE API Reference :
* https://engineering.linecorp.com/en/blog/using-line-notify-to-send-messages-to-line-from-the-command-line/
*
* January 2020. Brian Kim
*/
#include <SoftwareSerial.h>
#include <ESP8266WiFi.h>
#include <ESPAsyncTCP.h>
#include <ESPAsyncWebServer.h>
#include <FS.h>
#include <WiFiClientSecureAxTLS.h>
/**
* WiFi credentials
*/
#define WIFI_SSID "your-ssid"
#define WIFI_PASS "your-password"
/**
* LINE Notify credential
*/
#define LINE_TOKEN "your-line-token"
/**
* PMS7003 sensor pin map and packet header
*/
#define PMS7003_TX D5 // GPIO12
#define PMS7003_RX D6 // GPIO14
#define PMS7003_PREAMBLE_1 0x42 // From PMS7003 datasheet
#define PMS7003_PREAMBLE_2 0x4D
#define PMS7003_DATA_LENGTH 31
/**
* Wemos serial RX - TX PMS7003
* TX - RX
*/
SoftwareSerial _serial(PMS7003_TX, PMS7003_RX); // RX, TX
AsyncWebServer server(80);
int _pm1, _pm25, _pm10;
unsigned long previousMillis = 0;
const long interval = 600000; // Waiting time(milliseconds)
const int notifyLevel = 20; // PM2.5 threshold for notification
bool waitFlag = false;
void connectWifi() {
WiFi.mode(WIFI_STA);
WiFi.begin(WIFI_SSID, WIFI_PASS);
while (WiFi.status() != WL_CONNECTED) {
delay(500);
Serial.print(".");
}
Serial.println("");
Serial.println("WiFi connected");
Serial.print("IP address: ");
Serial.println(WiFi.localIP());
}
void notifyLine(String msg) {
WiFiClientSecure client;
client.setInsecure();
if (!client.connect("notify-api.line.me", 443)) {
Serial.println ("ERROR Connection failed");
return;
}
String req = "POST /api/notify HTTP/1.1\r\n";
req += "Host: notify-api.line.me\r\n";
req += "Authorization: Bearer " + String(LINE_TOKEN) + "\r\n";
req += "Cache-Control: no-cache\r\n";
req += "User-Agent: ESP8266\r\n";
req += "Connection: close\r\n";
req += "Content-Type: application/x-www-form-urlencoded\r\n";
req += "Content-Length: " + String(String("message=" + msg).length()) + "\r\n";
req += "\r\n";
req += "message=" + msg;
client.print(req);
Serial.print(req);
while (client.connected()) {
String line = client.readStringUntil('\n');
if (line == "\r") {
// delay(20000);
break;
}
Serial.println(line);
}
}
String readSensor() {
int checksum = 0;
unsigned char pms[32] = {0,};
String ret;
/**
* Search preamble for Packet
* Solve trouble caused by delay function
*/
while( _serial.available() &&
_serial.read() != PMS7003_PREAMBLE_1 &&
_serial.peek() != PMS7003_PREAMBLE_2 ) {
}
if( _serial.available() >= PMS7003_DATA_LENGTH ){
pms[0] = PMS7003_PREAMBLE_1;
checksum += pms[0];
for(int j=1; j<32 ; j++){
pms[j] = _serial.read();
if(j < 30)
checksum += pms[j];
}
_serial.flush();
if( pms[30] != (unsigned char)(checksum>>8)
|| pms[31]!= (unsigned char)(checksum) ){
Serial.println("Checksum error");
ret = String(_pm1) + " " + String(_pm25) + " " + String(_pm10);
return ret;
}
if( pms[0]!=0x42 || pms[1]!=0x4d ) {
Serial.println("Packet error");
ret = String(_pm1) + " " + String(_pm25) + " " + String(_pm10);
return ret;
}
_pm1 = makeWord(pms[10],pms[11]);
_pm25 = makeWord(pms[12],pms[13]);
_pm10 = makeWord(pms[14],pms[15]);
ret = String(_pm1) + " " + String(_pm25) + " " + String(_pm10);
// Serial.printf("PM1.0:%d PM2.5:%d PM10.0:%d\n", _pm1, _pm25, _pm10);
return ret;
}
}
void setup()
{
Serial.begin(115200); // For debugging
_serial.begin(9600); // For communicating with PMS7003 sensor
Serial.printf("\nAir quality monitoring system using PMS7003 sensor with WIFI, WEBSERVER, LINE NOTIFY\n");
Serial.printf("PM2.5 notify level:%d Waiting time:%d seconds\n",notifyLevel, interval/1000);
// Initialize filesystem
if(!SPIFFS.begin()){
Serial.println("ERROR SPIFFS failed");
return;
}
connectWifi(); // Connect to WiFi
server.on("/", HTTP_GET, [](AsyncWebServerRequest *request){
// request->send(SPIFFS, "/index.html", String(), false, templateHandler);
request->send(SPIFFS, "/index.html", "text/html");
});
server.on("/style.css", HTTP_GET, [](AsyncWebServerRequest *request){
request->send(SPIFFS, "/style.css", "text/css");
});
server.on("/line_logo.png", HTTP_GET, [](AsyncWebServerRequest *request){
request->send(SPIFFS, "/line_logo.png", "image/png");
});
/**
* Send measured data(PM1.0, PM2.5, PM10.0) back to client
* Data format : Each value is separated by white space
* Example : 11 22 33
*/
server.on("/updatesensorreading", HTTP_GET, [](AsyncWebServerRequest *request){
request->send_P(200, "text/plain", readSensor().c_str());
});
server.begin();
}
void loop()
{
unsigned long currentMillis = 0;
if (_pm25 >= notifyLevel && !waitFlag) {
String msg = "PM2.5 is ";
Serial.printf("PM2.5: %d\n",_pm25);
msg += String(_pm25);
notifyLine(msg);
waitFlag = true;
previousMillis = millis();
}
if (waitFlag) {
currentMillis = millis();
if ( currentMillis - previousMillis >= interval ) {
waitFlag = false;
previousMillis = currentMillis;
}
}
}
Step 4. Upload data to Wemos D1 mini

This step is to upload web server related files (HTML, CSS) to Wemos. These files are located in directory named data. Click "ESP8266 Sketch Data Upload" under Tools menu in Arduino IDE to upload these files to Wemos. Once it shows the measurement data, it will refresh every 3 seconds automatically.

HTML file

On web interface, the size of gauge is defined in width, height of options variable. Just change these values to customize chart size. And if you want to modify refresh rate, change the value of 30000 in setInterval function to other value.

<!-- Air quality monitoring system using PMS7003 sensor with WIFI, WEBSERVER
Hardware : Wemos D1 mini, PMS7003
Software : Arduino IDE, EPS8266 Sketch Data Upload
Library : ESPAsyncTCP, ESPAsyncWebServer -->
<!DOCTYPE html>
<html>
<head>
<title>Air quality monitor</title>
<meta name="viewport" content="width=device-width, initial-scale=1">
<meta name="mobile-web-app-capable" content="yes">
<link rel="stylesheet" type="text/css" href="style.css">
<script src="https://www.gstatic.com/charts/loader.js"></script>
<script>
google.charts.load('current', {'packages':['gauge','corechart']});
// Display clock above air quality gauge
function startClock() {
var now = new Date();
var hour = now.getHours();
var minute = now.getMinutes();
var second = now.getSeconds();
minute = minute < 10 ? "0" + minute : minute;
second = second < 10 ? "0" + second : second;
document.getElementById("clock_div").innerHTML =
hour + ":" + minute + ":" + second;
var tmp = setTimeout(startClock, 500);
}
</script>
</head>
<body onload="startClock()">
<h1>Air quality monitor</h1>
<div id="clock_div"></div>
<div id="chart_div"></div>
<script>
google.charts.setOnLoadCallback(drawChart);
function drawChart() {
var data = google.visualization.arrayToDataTable([
['Label', 'Value'],
['PM1.0', 0],
['PM2.5', 0],
['PM10', 0]
]);
var options = {
width: 800, height: 240,
redFrom: 90, redTo: 100,
yellowFrom:75, yellowTo: 90,
minorTicks: 5
};
var chart = new google.visualization.Gauge(document.getElementById('chart_div'));
chart.draw(data, options);
setInterval(function ( ) {
var xhttp = new XMLHttpRequest();
xhttp.onreadystatechange = function() {
if (this.readyState == 4 && this.status == 200) {
var pms = this.responseText.split(" ");
data.setValue(0, 1, pms[0]);
data.setValue(1, 1, pms[1]);
data.setValue(2, 1, pms[2]);
chart.draw(data, options);
}
};
xhttp.open("GET", "/updatesensorreading", true);
xhttp.send();
}, 3000 );
}
</script>
</body>
</html>
view raw index.html hosted with ❤ by GitHub
CSS file

/* Air quality monitoring system using PMS7003 sensor with WIFI, WEBSERVER
Hardware : Wemos D1 mini, PMS7003
Software : Arduino IDE, EPS8266 Sketch Data Upload
Library : ESPAsyncTCP, ESPAsyncWebServer */
html {
font-family: monospace;
}
h1 {
font-size:45px;
}
body {
text-align: center;
background-image: url("line_logo.png");
background-repeat: no-repeat;
}
div {
display: table;
margin: 0 auto;
}
#clock_div {
font-size:27px;
}

Results


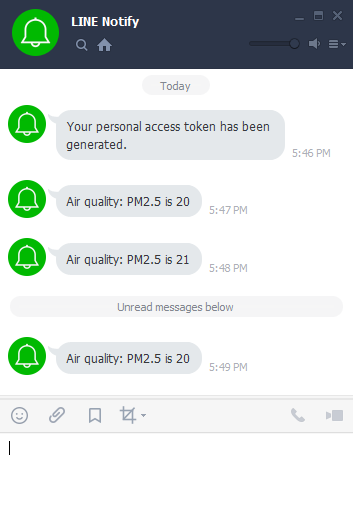
After uploading firmware, Wemos restarts itself automatically. Once Wemos D1 mini has restarted, serial monitor shows a welcome message, PM2.5 threshold, and waiting period. When PM2.5 is higher than threshold it will send Line notification to the user as below.


One Wemos sends notification, Line messenger will show you the content of it as below. Notice that "Air quality" in the message is actually the token name we typed when the token was created.


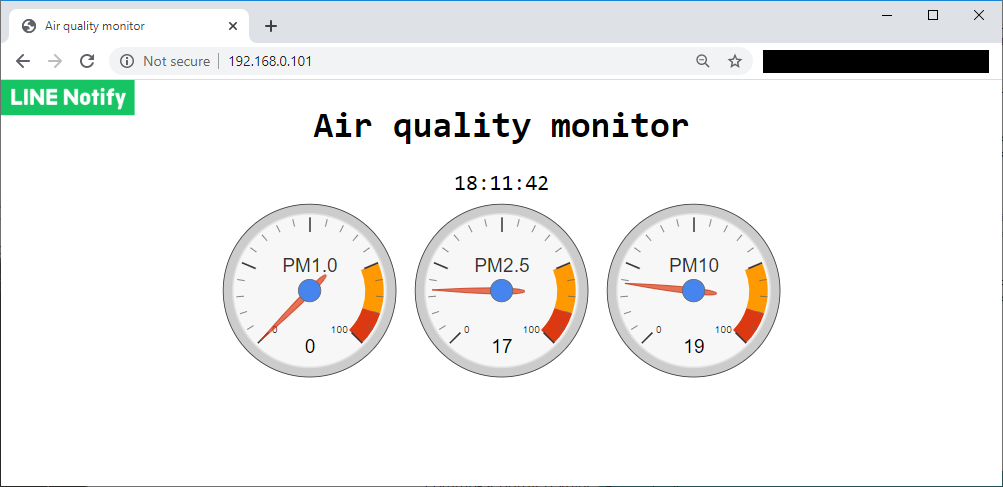
Use web browser to connect to the device, then it will show current time and visualized information, which is based on Google Chart API. It will refresh itself every 3 seconds automatically.


References

Source codes at github

ESP8266-based WiFi air quality monitoring system using PMS7003 sensor with Google Chart visualization

Introduction


Low-cost (US$19) WiFi Air Quality Monitoring System with Google Chart visualization


Purpose


The aim of this project is to use PMS7003 sensor to measure air quality and visualize the result with Google Chart API. Air quality measurement data is presented in gauge type. We can check current status via web browser using WiFi connection.

Features


This project is based on our previous project named "ESP8266-based air quality monitoring system using PMS7003 sensor". It adds web server functionality to offer web-based user interface, which is based on Google Chart API to visualize measured air quality data. For web server, we use ESPAsyncWebServer library and it is available at github. Additionally, we need to install EPS8266 Sketch Data Upload to upload web server related files to Wemos. For example, in this project, we use HTML, CSS files under data directory. In other words, we need to upload sketch and web related files separately.

Prerequisites


- Arduino IDE
ESP8266 package for Arduino IDE
EPS8266 Sketch Data Upload
ESPAsyncTCP Library
ESPAsyncWebServer Library

Requirements


Hardware
-Wemos D1 mini : US$1.77 on Aliexpress
-PMS7003 air quality sensor : US$16.80 on Aliexpress

Instructions


Step 1. Setup hardware

PMS7003 sensor comes with a small breakout board, which has TX, RX, VCC, GND pins. Connect TX of PMS7003 to D5 of Wemos, RX to D6, VCC to 5V, and GND to G. Finally, connect micro usb to Wemos for uploading firmware, and check serial monitor and serial plotter in Android IDE to make sure the sensor works correctly.


Step 2. Upload sketch to Wemos D1 mini

This step is to upload sketch to Wemos as usual. In the following sketch, two values need to be modified with your own.

WIFI_SSID : Name of WiFi router
WIFI_PASS Password of WiFi router

/**
* Air quality monitoring system using PMS7003 sensor with WIFI, WEBSERVER
*
* Hardware : Wemos D1 mini, PMS7003
* Software : Arduino IDE, EPS8266 Sketch Data Upload
* Library : ESPAsyncTCP, ESPAsyncWebServer
*
* January 2020. Brian Kim
*/
#include <SoftwareSerial.h>
#include <ESP8266WiFi.h>
#include <ESPAsyncTCP.h>
#include <ESPAsyncWebServer.h>
#include <FS.h>
/**
* WiFi credentials
*/
#define WIFI_SSID "your-ssid"
#define WIFI_PASS "your-password"
/**
* PMS7003 sensor pin map and packet header
*/
#define PMS7003_TX D5 // GPIO12
#define PMS7003_RX D6 // GPIO14
#define PMS7003_PREAMBLE_1 0x42 // From PMS7003 datasheet
#define PMS7003_PREAMBLE_2 0x4D
#define PMS7003_DATA_LENGTH 31
/**
* Wemos serial RX - TX PMS7003
* TX - RX
*/
SoftwareSerial _serial(PMS7003_TX, PMS7003_RX); // RX, TX
AsyncWebServer server(80);
int _pm1, _pm25, _pm10;
void connectWifi() {
WiFi.mode(WIFI_STA);
WiFi.begin(WIFI_SSID, WIFI_PASS);
while (WiFi.status() != WL_CONNECTED) {
delay(500);
Serial.print(".");
}
Serial.println("");
Serial.println("WiFi connected");
Serial.print("IP address: ");
Serial.println(WiFi.localIP());
}
String readSensor() {
int checksum = 0;
unsigned char pms[32] = {0,};
String ret;
/**
* Search preamble for Packet
* Solve trouble caused by delay function
*/
while( _serial.available() &&
_serial.read() != PMS7003_PREAMBLE_1 &&
_serial.peek() != PMS7003_PREAMBLE_2 ) {
}
if( _serial.available() >= PMS7003_DATA_LENGTH ){
pms[0] = PMS7003_PREAMBLE_1;
checksum += pms[0];
for(int j=1; j<32 ; j++){
pms[j] = _serial.read();
if(j < 30)
checksum += pms[j];
}
_serial.flush();
if( pms[30] != (unsigned char)(checksum>>8)
|| pms[31]!= (unsigned char)(checksum) ){
Serial.println("Checksum error");
ret = String(_pm1) + " " + String(_pm25) + " " + String(_pm10);
return ret;
}
if( pms[0]!=0x42 || pms[1]!=0x4d ) {
Serial.println("Packet error");
ret = String(_pm1) + " " + String(_pm25) + " " + String(_pm10);
return ret;
}
_pm1 = makeWord(pms[10],pms[11]);
_pm25 = makeWord(pms[12],pms[13]);
_pm10 = makeWord(pms[14],pms[15]);
ret = String(_pm1) + " " + String(_pm25) + " " + String(_pm10);
return ret;
}
}
void setup()
{
Serial.begin(115200); // For debugging
_serial.begin(9600); // For communicating with PMS7003 sensor
Serial.printf("\nAir quality monitoring system using PMS7003 sensor with WIFI, WEBSERVER\n");
// Initialize filesystem
if(!SPIFFS.begin()){
Serial.println("ERROR SPIFFS failed");
return;
}
connectWifi(); // Connect to WiFi
server.on("/", HTTP_GET, [](AsyncWebServerRequest *request){
// request->send(SPIFFS, "/index.html", String(), false, templateHandler);
request->send(SPIFFS, "/index.html", "text/html");
});
server.on("/style.css", HTTP_GET, [](AsyncWebServerRequest *request){
request->send(SPIFFS, "/style.css", "text/css");
});
/**
* Send measured data(PM1.0, PM2.5, PM10.0) back to client
* Data format : Each value is separated by white space
* Example : 11 22 33
*/
server.on("/updatesensorreading", HTTP_GET, [](AsyncWebServerRequest *request){
request->send_P(200, "text/plain", readSensor().c_str());
});
server.begin();
}
void loop()
{
}
Step 3. Upload data to Wemos D1 mini

This step is to upload web server related files (HTML, CSS) to Wemos. These files are located in directory named data. Click "ESP8266 Sketch Data Upload" under Tools menu in Arduino IDE to upload these files to Wemos. Once it shows the measurement data, it will refresh every 3 seconds automatically.

HTML file

The size of gauge is defined in width, height of options variable. Just change these values to customize chart size. And if you want to modify refresh rate, change the value of 30000 in setInterval function to other value.

<!-- Air quality monitoring system using PMS7003 sensor with WIFI, WEBSERVER
Hardware : Wemos D1 mini, PMS7003
Software : Arduino IDE, EPS8266 Sketch Data Upload
Library : ESPAsyncTCP, ESPAsyncWebServer -->
<!DOCTYPE html>
<html>
<head>
<title>Air quality monitor</title>
<meta name="viewport" content="width=device-width, initial-scale=1">
<meta name="mobile-web-app-capable" content="yes">
<link rel="stylesheet" type="text/css" href="style.css">
<script src="https://www.gstatic.com/charts/loader.js"></script>
<script>
google.charts.load('current', {'packages':['gauge','corechart']});
// Display clock above air quality gauge
function startClock() {
var now = new Date();
var hour = now.getHours();
var minute = now.getMinutes();
var second = now.getSeconds();
minute = minute < 10 ? "0" + minute : minute;
second = second < 10 ? "0" + second : second;
document.getElementById("clock_div").innerHTML =
hour + ":" + minute + ":" + second;
var tmp = setTimeout(startClock, 500);
}
</script>
</head>
<body onload="startClock()">
<h1>Air quality monitor</h1>
<div id="clock_div"></div>
<div id="chart_div"></div>
<script>
google.charts.setOnLoadCallback(drawChart);
function drawChart() {
var data = google.visualization.arrayToDataTable([
['Label', 'Value'],
['PM1.0', 0],
['PM2.5', 0],
['PM10', 0]
]);
var options = {
width: 800, height: 240,
redFrom: 90, redTo: 100,
yellowFrom:75, yellowTo: 90,
minorTicks: 5
};
var chart = new google.visualization.Gauge(document.getElementById('chart_div'));
chart.draw(data, options);
setInterval(function ( ) {
var xhttp = new XMLHttpRequest();
xhttp.onreadystatechange = function() {
if (this.readyState == 4 && this.status == 200) {
var pms = this.responseText.split(" ");
data.setValue(0, 1, pms[0]);
data.setValue(1, 1, pms[1]);
data.setValue(2, 1, pms[2]);
chart.draw(data, options);
}
};
xhttp.open("GET", "/updatesensorreading", true);
xhttp.send();
}, 3000 );
}
</script>
</body>
</html>
view raw index.html hosted with ❤ by GitHub
CSS file

/* Air quality monitoring system using PMS7003 sensor with WIFI, WEBSERVER
Hardware : Wemos D1 mini, PMS7003
Software : Arduino IDE, EPS8266 Sketch Data Upload
Library : ESPAsyncTCP, ESPAsyncWebServer */
html {
font-family: monospace;
}
h1 {
font-size:45px;
}
body {
text-align: center;
}
div {
display: table;
margin: 0 auto;
}
#clock_div {
font-size:27px;
}
view raw style.css hosted with ❤ by GitHub

Results


After uploading firmware, Wemos restarts itself automatically. Once Wemos D1 mini has restarted, serial monitor shows welcome message as below. Remember IP address of Wemos to connect it via web browser.


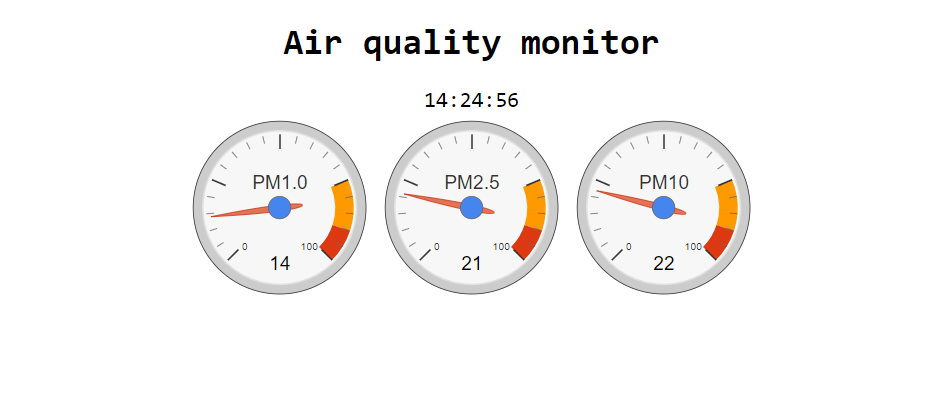
Use web browser to connect to the device, then it will show current time and visualized information, which is based on Google Chart API. It will refresh itself every 3 seconds automatically.


References

Source codes at github