Introduction
Low-cost (US$19) Air Quality Monitoring System with Line notification


Purpose
The aim of this project is to receive Line notification when air quality is higher than certain level from Wemos. It uses PMS7003 sensor to measure air quality and visualizes the result with Google Chart API. Air quality measurement data is presented in gauge type. We can check current status via web browser using WiFi connection.
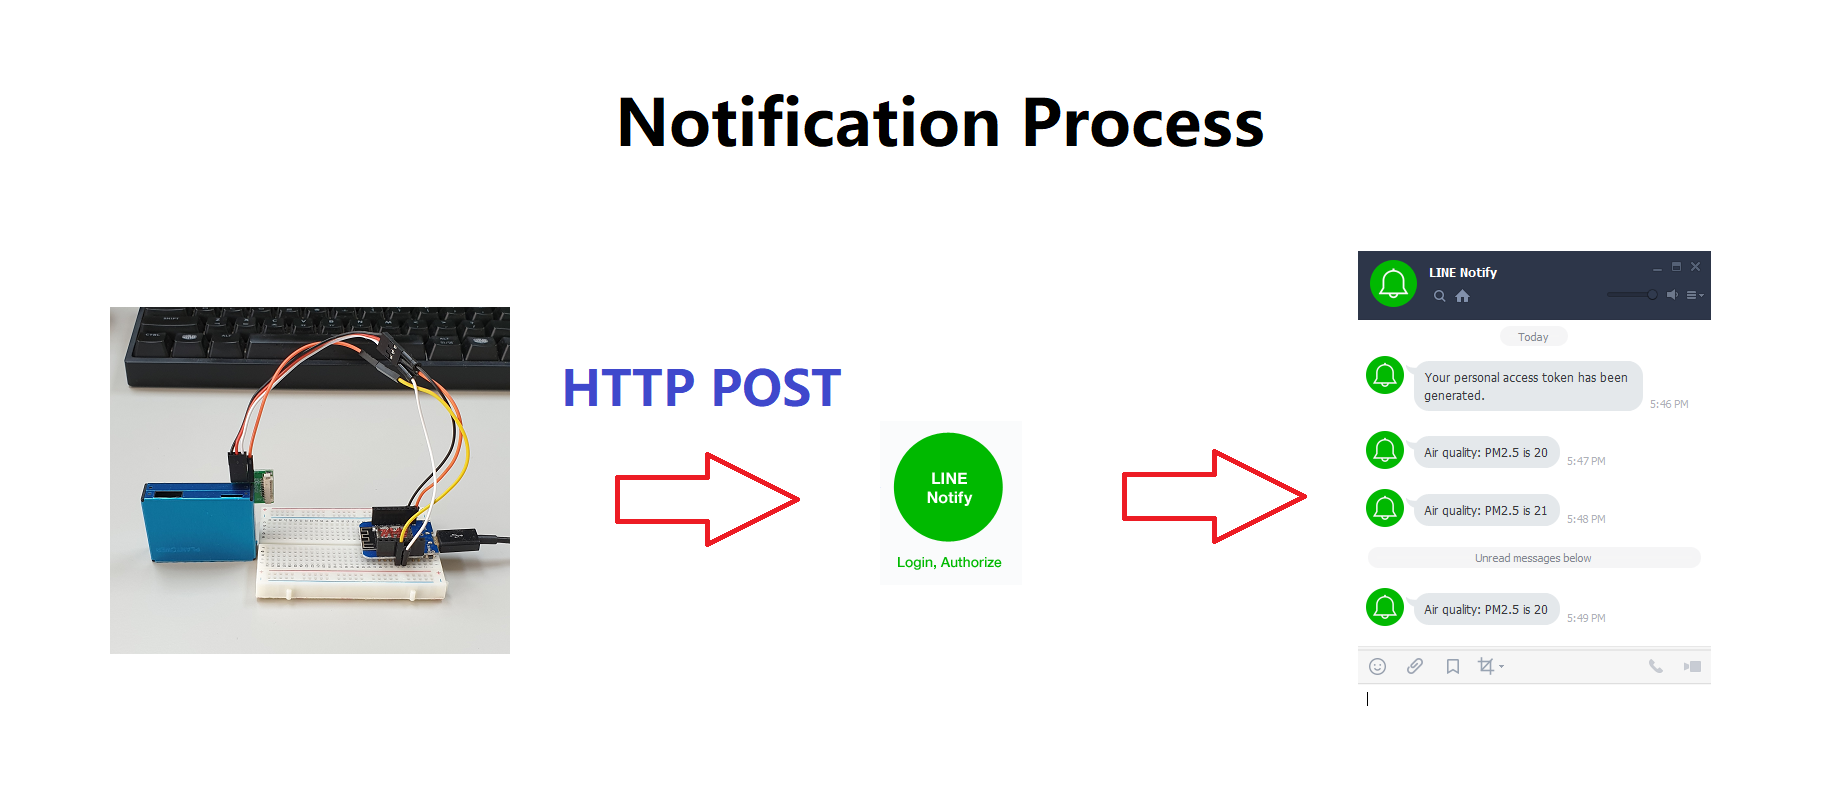
This project is based on our previous project named "IoT Laboratory: ESP8266-based WiFi air quality monitoring system using PMS7003 sensor with Google Chart visualization." It adds Line notification functionality to notify user when the level of air quality hits a certain level which is specified by the user in the source code. The entire process for sending Line notification is like below. Wemos sends HTTP POST request to Line Notify website, then, the message will be delivered to our Line messenger.
For web server, we use ESPAsyncWebServer library and it is available at github. Additionally, we need to install EPS8266 Sketch Data Upload to upload web server related files to Wemos. For example, in this project, we use HTML, CSS files under data directory. In other words, we need to upload sketch and web related files separately.
Features
This project is based on our previous project named "IoT Laboratory: ESP8266-based WiFi air quality monitoring system using PMS7003 sensor with Google Chart visualization." It adds Line notification functionality to notify user when the level of air quality hits a certain level which is specified by the user in the source code. The entire process for sending Line notification is like below. Wemos sends HTTP POST request to Line Notify website, then, the message will be delivered to our Line messenger.
For web server, we use ESPAsyncWebServer library and it is available at github. Additionally, we need to install EPS8266 Sketch Data Upload to upload web server related files to Wemos. For example, in this project, we use HTML, CSS files under data directory. In other words, we need to upload sketch and web related files separately.
Prerequisites
- ESP8266 package for Arduino IDE
- EPS8266 Sketch Data Upload
- ESPAsyncTCP Library
- ESPAsyncWebServer Library
- Line account and Token
Hardware
-Wemos D1 mini : US$1.77 on Aliexpress
-PMS7003 air quality sensor : US$16.80 on Aliexpress
Step 1. Setup hardware
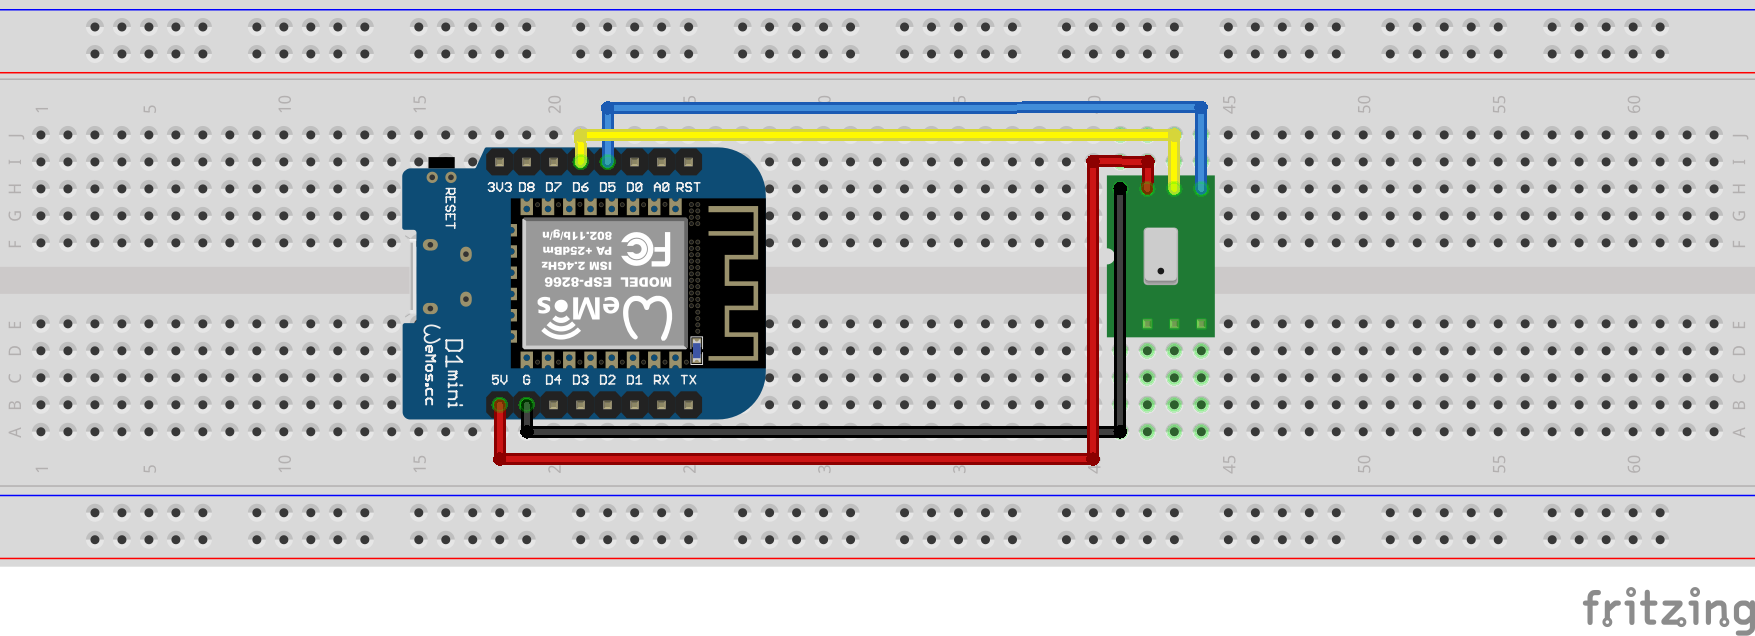
PMS7003 sensor comes with a small breakout board, which has TX, RX, VCC, GND pins. Connect TX of PMS7003 to D5 of Wemos, RX to D6, VCC to 5V, and GND to G. Finally, connect micro usb to Wemos for uploading firmware, and check serial monitor and serial plotter in Android IDE to make sure the sensor works correctly.
Step 2. Create Line account and Token for notification
To be able to receive Line notification, we need to get a token from Line Notify website and put it in our source sketch. Useful tutorial on how to create a token is available at https://engineering.linecorp.com/en/blog/using-line-notify-to-send-messages-to-line-from-the-command-line/. Take a good look at it to understand basic procedure to create a token.
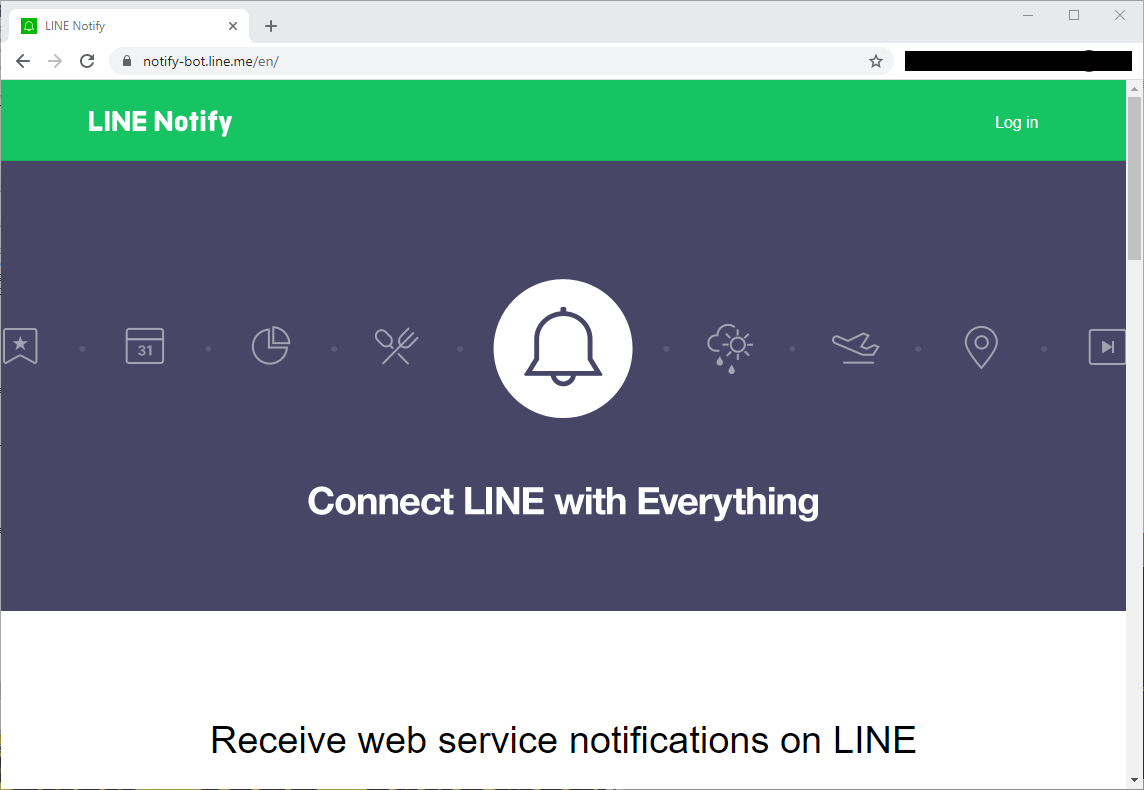
First, login to the LINE Notify website
Click "My page"

Click "Generate token"

Important! Then, type any name for the token and choose who will receive Line notification. We can choose a single recipient or group. For testing purpose, let's choose myself here, then it will send notification only to me.
Step 3. Upload sketch to Wemos D1 mini
This step is to upload sketch to Wemos as usual. In the following sketch, following values need to be modified with your own.
- WIFI_SSID : Name of WiFi router
- WIFI_PASS : Password of WiFi router
- LINE_TOKEN : Token string from Line Notify website
In this example sketch, it send Line notification only when PM2.5 hit 20 or higher. And before sending again it waits 10 minutes. These values can be changed by user.
- notifyLevel : PM2.5 threshold for Line notification
- interval : Waiting time (specify in milliseconds)
Step 4. Upload data to Wemos D1 mini
This step is to upload web server related files (HTML, CSS) to Wemos. These files are located in directory named data. Click "ESP8266 Sketch Data Upload" under Tools menu in Arduino IDE to upload these files to Wemos. Once it shows the measurement data, it will refresh every 3 seconds automatically.
HTML file
On web interface, the size of gauge is defined in width, height of options variable. Just change these values to customize chart size. And if you want to modify refresh rate, change the value of 30000 in setInterval function to other value.
CSS file
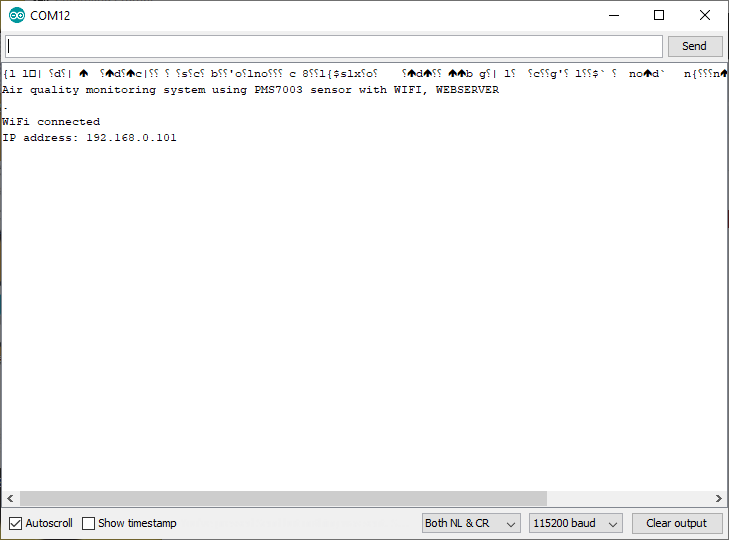
After uploading firmware, Wemos restarts itself automatically. Once Wemos D1 mini has restarted, serial monitor shows a welcome message, PM2.5 threshold, and waiting period. When PM2.5 is higher than threshold it will send Line notification to the user as below.

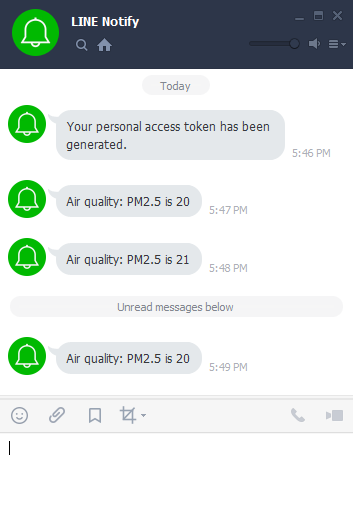
One Wemos sends notification, Line messenger will show you the content of it as below. Notice that "Air quality" in the message is actually the token name we typed when the token was created.
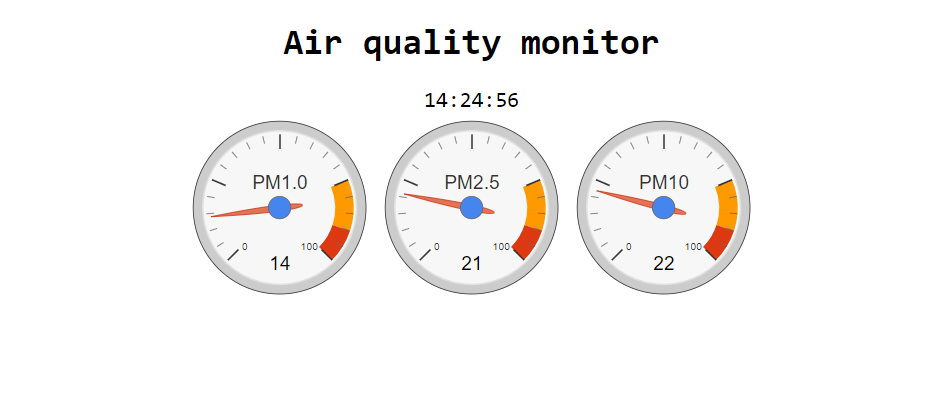
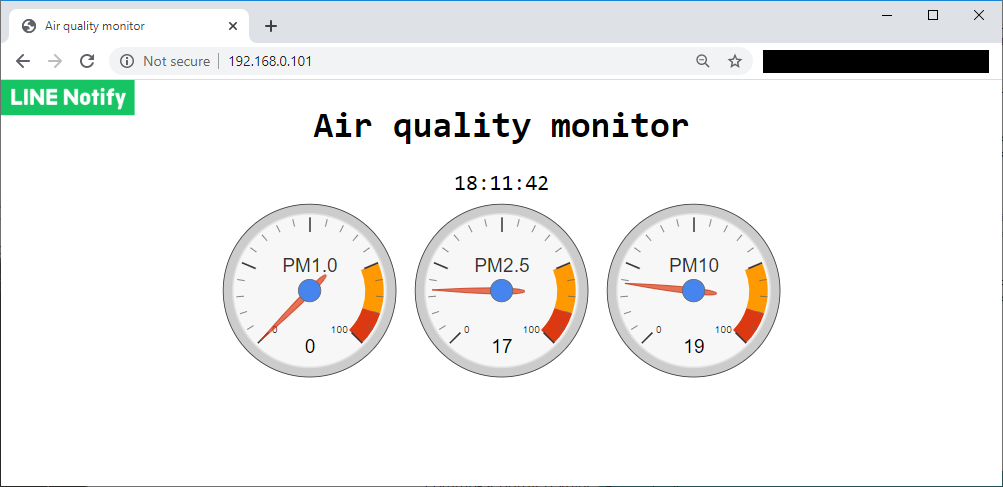
Use web browser to connect to the device, then it will show current time and visualized information, which is based on Google Chart API. It will refresh itself every 3 seconds automatically.
- EPS8266 Sketch Data Upload
- ESPAsyncTCP Library
- ESPAsyncWebServer Library
- Line account and Token
Requirements
-Wemos D1 mini : US$1.77 on Aliexpress
-PMS7003 air quality sensor : US$16.80 on Aliexpress
Instructions
PMS7003 sensor comes with a small breakout board, which has TX, RX, VCC, GND pins. Connect TX of PMS7003 to D5 of Wemos, RX to D6, VCC to 5V, and GND to G. Finally, connect micro usb to Wemos for uploading firmware, and check serial monitor and serial plotter in Android IDE to make sure the sensor works correctly.
Step 2. Create Line account and Token for notification
To be able to receive Line notification, we need to get a token from Line Notify website and put it in our source sketch. Useful tutorial on how to create a token is available at https://engineering.linecorp.com/en/blog/using-line-notify-to-send-messages-to-line-from-the-command-line/. Take a good look at it to understand basic procedure to create a token.
First, login to the LINE Notify website
Click "My page"
Click "Generate token"
Important! Then, type any name for the token and choose who will receive Line notification. We can choose a single recipient or group. For testing purpose, let's choose myself here, then it will send notification only to me.
Step 3. Upload sketch to Wemos D1 mini
This step is to upload sketch to Wemos as usual. In the following sketch, following values need to be modified with your own.
- WIFI_SSID : Name of WiFi router
- WIFI_PASS : Password of WiFi router
- LINE_TOKEN : Token string from Line Notify website
In this example sketch, it send Line notification only when PM2.5 hit 20 or higher. And before sending again it waits 10 minutes. These values can be changed by user.
- notifyLevel : PM2.5 threshold for Line notification
- interval : Waiting time (specify in milliseconds)
Step 4. Upload data to Wemos D1 mini
This step is to upload web server related files (HTML, CSS) to Wemos. These files are located in directory named data. Click "ESP8266 Sketch Data Upload" under Tools menu in Arduino IDE to upload these files to Wemos. Once it shows the measurement data, it will refresh every 3 seconds automatically.
HTML file
On web interface, the size of gauge is defined in width, height of options variable. Just change these values to customize chart size. And if you want to modify refresh rate, change the value of 30000 in setInterval function to other value.
CSS file
Results
One Wemos sends notification, Line messenger will show you the content of it as below. Notice that "Air quality" in the message is actually the token name we typed when the token was created.
Use web browser to connect to the device, then it will show current time and visualized information, which is based on Google Chart API. It will refresh itself every 3 seconds automatically.
References
- IoT Laboratory: ESP8266-based WiFi air quality monitoring system using PMS7003 sensor with Google Chart visualization
- IoT Laboratory: ESP8266-based WiFi air quality monitoring system using PMS7003 sensor
- IoT Laboratory: ESP8266-based WiFi air quality monitoring system using PMS7003 sensor
- IoT Laboratory: ESP8266-based air quality monitoring system using PMS7003 sensor
- IoT Laboratory: ESP8266-based WiFi MQTT air quality monitoring system using PMS7003 sensor
- IoT Laboratory: ESP8266-based WiFi MQTT air quality monitoring system using PMS7003 sensor
- PMS7003 sensor : http://www.plantower.com/en/content/?110.html
- PMS7003 datasheet pdf
- Arduino WiFiClient
- EPS8266 Sketch Data Upload
- ESPAsyncTCP Library
- ESPAsyncWebServer Library
- Google Chart : Gauge
- LINE Notify
- Using LINE Notify to send messages to LINE from the command-line - LINE ENGINEERING
Source codes at github- Arduino WiFiClient
- EPS8266 Sketch Data Upload
- ESPAsyncTCP Library
- ESPAsyncWebServer Library
- Google Chart : Gauge
- LINE Notify
- Using LINE Notify to send messages to LINE from the command-line - LINE ENGINEERING